Heartland Advisors

Heartland Value Fund 2Q23 Portfolio Manager Commentary

Executive Summary

  • In the quarter risk-taking, led by a frenzy in artificial intelligence-related stocks, took over the equity market.
  • Most of this year’s gains have been driven by a handful of giant tech stocks. 
  • Historically, such narrowly led markets aren’t sustainable and usually followed by prolonged periods of small-cap outperformance.

Past performance is no guarantee of future results and investment returns and principal value of the Fund will fluctuate so that shares, when redeemed, may be worth more or less than the original cost. Current performance may be higher or lower than the performance quoted. Call 800-432-7856 or visit heartlandadvisors.com for current month end performance.

“The easiest way to solve a problem is to deny it exists .”

​​​​​​—Isaac Asimov

Was it surprising that risk-taking returned to the market in the second quarter, just a few months after a series of bank failures in March seemed to scare investors straight? Not really. Denial is a natural phase in the investment cycle, coming after delusion but preceding capitulation and despair. 

Last quarter, investors chose to overlook a long list of nagging problems, including the Federal Reserve’s still-restrictive monetary policy, 6-month T-bills yielding 5.4% — tough competition for equities — and the 14th consecutive monthly decline in the Leading Economic Indicators.

On top of this, investors — who’ve been in a frenzy over artificial intelligence-related stocks — are holding out hope that the Federal Reserve isn’t simply done tightening, but that rate cuts could be just around the corner. In that case, they figured, the same playbook that worked in previous easing cycles might be useful again, with high-beta and low-quality stocks outperforming, which is what took place in the second quarter. The S&P 500® index was up almost 17% for the year, with the technology sector returning more than 42%.

What these investors are forgetting is that in the event the central bank is ready to take its foot off the brakes and tap the accelerator — still a big if — lenders are picking up where policy makers may be leaving off. Banks are hunkering down, tightening their lending standards while cutting back on loan issuance.
Meanwhile, there’s no denying that the breadth of this market is as narrow as it’s been in recent memory. So far this year, a smaller percentage of stocks are beating the benchmark than was the case in the run up to the global financial crisis, the dotcom crash, and the early ’80s recessions (see chart below).

Percentage of S&P 500 Stocks that Outperformed the S&P 500

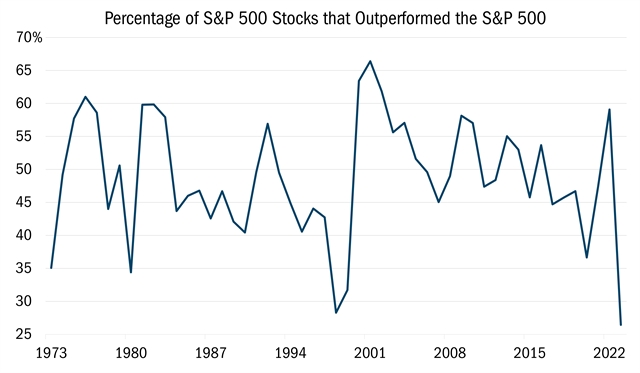
Source: Ned Davis Research, yearly data from 12/31/1973 to 12/31/2022 and partial year data from 1/1/2023 to 6/22/2023. This chart represents the percentage of S&P 500® Stocks that outperformed the S&P 500® over the calendar year.  All indices are unmanaged. It is not possible to invest directly in an index. Past performance does not guarantee future results.

In fact, just seven companies — the so-called Magnificent 7: Apple, Alphabet, Tesla, Amazon, Microsoft, Meta and Nvidia — account for the vast majority of year-to-date gains. And the five biggest names in the S&P 500® account for almost 23% of the entire benchmark. Historically, the market cap share of the Top Five has stood at around 13%.

Why is this important? Historically, narrow markets tend to be associated with poor performance while wide breadth is correlated with strong price gains in the 12 months after the fact. No wonder one of Robert Farrell’s famous rules for investing is that the “markets are strongest when they are broad and weakest when they narrow to a handful of blue-chip names.” 

The good news is, there is a corollary to this rule — one that signals hope for patient, value-minded investors who focus on small-cap names. Ned Davis Research examined past periods in which the market’s breadth narrowed — specifically, when fewer than 30% of the stocks in the S&P 500® were beating the benchmark. It found that in the 12 months following those instances, small stocks outperformed large stocks every time.

 Russell 2000/1000 Ratio Performance After Percent of S&P 500 Stocks Outperforming Index in Last Three Months

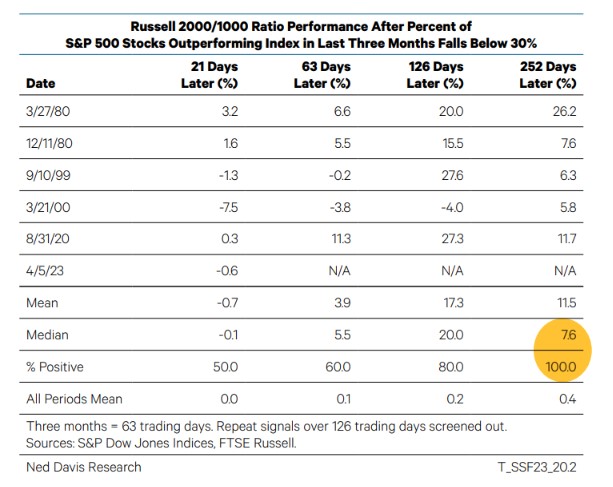
Source: Ned Davis Research, daily data from 3/27/1980 to 5/31/2023. This chart represents the Russell 2000® to 1000® ratio performance after the percent of S&P 500® stocks outperforming index in last three months falls below 30%.  All indices are unmanaged. It is not possible to invest directly in an index. Past performance does not guarantee future results.

The market’s advance, fueled by P/E expansion, the allure of AI stocks, and the hope for imminent Federal Reserve rate cuts, in our view is destined to disappoint. What will it take for investors to see these risks and to focus on the fundamentals and valuations again? We believe this will happen once the markets begin to price in growing credit and solvency risks that are materializing as the effects of Federal Reserve actions take hold. 

Attribution Analysis & Portfolio Activity

This was a challenging quarter in a difficult year. While the NASDAQ Composite Index was up more than 30% year to date, the Russell 2000® Value Index was only up 2.5%. In the second quarter, 7 out of 11 sectors in the Russell 2000® Value Index posted gains. 

The Heartland Value Fund also generated positive returns in 7 out of 11 sectors. As has happened in the past, stock selection provided a boost, allowing us to outperform the benchmark in Financials and Healthcare.

Although our performance was consistent with the benchmark, we lagged in the tech-heavy broader markets. Yet our approach in these moments is to be patient and add to holdings with attractive risk/reward characteristics and that fit our 10 Principles of Value Investing.™ We remain focused on uncovering businesses with strong leadership and resilient balance sheets offering compelling valuations. 

Below are three new additions that are examples of taking what the market is giving us:

Consumer Discretionary. Mohawk (MHK) is a new position that represents a perfect example of a stock that has “come to us.” A leading manufacturer of flooring including carpets, tiles, and wood and vinyl products for the residential and commercial markets, Mohawk ran into stiff headwinds in recent years owing to high inflation in its source materials. This compressed their margins, and the stock price was nearly cut in half between June 2021 and early this year. 

We believe the worst of those pricing pressures are largely behind the business, which stands to benefit from several trends, including ongoing growth in home remodeling; the anticipated reacceleration of existing home sales once rates begin to stabilize; and office space conversions as the commercial real estate market struggles with hybrid work. We purchased the shares when they were selling at around 6 times our estimated 2024 earnings, even though the stock has historically traded at a P/E of 15.

Technology. Electronic manufacturing services companies, like Benchmark Electronics (BHE), tend to do well in terms of profit and sales growth when times are good but poorly when times are bad, owing in part to their significant fixed cost overhead. 

Though management has shifted its production mix away from lower-margin and slower-growth segments (like advanced computing) and toward higher-margin and faster-growth areas (like semi-cap equipment), BHE’s margins failed to deliver during the recent downturn in the semiconductor cycle. Moreover, recent moves to expand capacity to help customers “re-shore” manufacturing were not fully scaled, further weighing on margins. This short-term disappointment caused the stock to sell-off sharply and approach our downside target, creating a compelling entry point. 

We believe management has now positioned the business in segments that will allow for above-average industry growth and margin expansion. BHE trades at 12 times 2023 earnings and 10 times 2024 profits. By comparison, industry peers with similar growth and margin expansion opportunities are trading at P/E ratios (based on 2024 earnings) in the low- to mid-teens.

Industrials. Healthcare Services Group (HCSG) manages housekeeping, laundry, dining, and nutritional services within the healthcare market. The stock has come under pressure in recent years, as occupancy levels at their clients’ facilities plummeted during the global pandemic. Meanwhile, inflation in the aftermath of the pandemic disadvantaged HCSG’s contract pricing. We believe those headwinds have abated, as occupancy is improving, and the company is restructuring its contracts to include more dynamic pricing. There is also a significant opportunity to gain market share, as only 30% of skilled nursing facilities currently outsource their housekeeping.

Management’s efforts have guided EBITDA margins back to 6%. Today, HCSG sports a balance sheet that exceeds our expectations with net cash and strong free cash flow and trades at 0.6X enterprise value to sales. Yet when it was at this level of profitability in the past, the business was priced at 1.5X EV/Sales.

Outlook

This mega-tech-driven market has been challenging for small stock performance. Yet we believe this remains a constructive environment for Value investors who are disciplined. What you buy — and the price you pay — matters at the end of the day. We are focused on what the market is giving us, being extremely selective in identifying opportunities that can shine over the next market cycle, not just the coming quarter. Thank you for your continued trust and confidence.

Fundamentally Yours, The Heartland Team

Please wait while we gather your results.

Portfolio Management Team

Heartland Advisors Value Investing Portfolio Manager Will Nasgovitz

Will Nasgovitz

CEO and Portfolio Manager

Heartland Advisors Value Investing Portfolio Manager Bill Nasgovitz

Bill Nasgovitz

Chairman and Portfolio Manager

Fund Returns

Scroll over to view complete data

*Not annualized

Source: FactSet Research Systems Inc., Russell®, and Heartland Advisors, Inc.

The inception date for the Value Fund is 12/28/1984 for the investor class and 5/1/2008 for the institutional class.

Value Fund Quick Links

Factsheet


Download PDF

Commentary


View Commentary

Attribution & Contribution Reports

Sign In

Holdings


View Holdings


Email Sign Up


©2024 Heartland Advisors | 790 N. Water Street, Suite 1200, Milwaukee, WI 53202 | Business Office: 414-347-7777 | Financial Professionals: 888-505-5180 | Individual Investors: 800-432-7856

In the prospectus dated 5/1/2023, the Gross Fund Operating Expenses for the investor and institutional classes of the Value Fund are 1.09% and 0.98%, respectively.

Past performance does not guarantee future results. Performance represents past performance; current returns may be lower or higher. Performance for institutional class shares prior to their initial offering is based on the performance of investor class shares. The investment return and principal value will fluctuate so that an investor's shares, when redeemed, may be worth more or less than the original cost. All returns reflect reinvested dividends and capital gains distributions, but do not reflect the deduction of taxes that an investor would pay on distributions or redemptions. Subject to certain exceptions, shares of a Fund redeemed or exchanged within 10 days of purchase are subject to a 2% redemption fee. Performance does not reflect this fee, which if deducted would reduce an individual's return. To obtain performance through the most recent month end, call 800-432-7856 or visit heartlandadvisors.com.

An investor should consider the Funds’ investment objectives, risks, and charges and expenses carefully before investing or sending money. This and other important information may be found in the Funds' prospectus. To obtain a prospectus, please call 800-432-7856 or visit heartlandadvisors.com. Please read the prospectus carefully before investing.

As of 6/30/2023, Benchmark Electronics, Inc. (BHE), Healthcare Services Group Inc (HCSG), and Mohawk Industries, Inc. (MHK), represented 0.87%, 0.78%, and 1.55% of the Value Fund’s net assets, respectively. Alphabet Inc. (Class A) (GOOGL), Amazon.com Inc (AMZN), Apple Computer Inc. (AAPL), Nvidia Corporation (NVDA), Meta Platforms Inc, Class A (META), Microsoft Corporation (MSFT), and Tesla (TSLA), were unowned by the Value Fund.

Statements regarding securities are not recommendations to buy or sell.

Portfolio holdings are subject to change. Current and future portfolio holdings are subject to risk.

The Value Fund primarily invests in small companies selected on a value basis. Such securities generally are more volatile and less liquid than those of larger companies.

Value investments are subject to the risk that their intrinsic value may not be recognized by the broad market.

The Value Fund seeks long-term capital appreciation through investing in small companies.

The above individuals are registered representatives of ALPS Distributors, Inc.

The Heartland Funds are distributed by ALPS Distributors, Inc.

The statements and opinions expressed in this article are those of the presenter(s). Any discussion of investments and investment strategies represents the presenters’ views as of the date created and are subject to change without notice. The opinions expressed are for general information only and are not intended to provide specific advice or recommendations for any individual. The specific securities discussed, which are intended to illustrate the advisor’s investment style, do not represent all of the securities purchased, sold, or recommended by the advisor for client accounts, and the reader should not assume that an investment in these securities was or would be profitable in the future. Certain security valuations and forward estimates are based on Heartland Advisors’ calculations. Any forecasts may not prove to be true. 

Economic predictions are based on estimates and are subject to change.

There is no guarantee that a particular investment strategy will be successful.

Sector and Industry classifications are sourced from GICS®.The Global Industry Classification Standard (GICS®) is the exclusive intellectual property of MSCI Inc. (MSCI) and S&P Global Market Intelligence (“S&P”).  Neither MSCI, S&P, their affiliates, nor any of their third party providers (“GICS Parties”) makes any representations or warranties, express or implied, with respect to GICS or the results to be obtained by the use thereof, and expressly disclaim all warranties, including warranties of accuracy, completeness, merchantability and fitness for a particular purpose.  The GICS Parties shall not have any liability for any direct, indirect, special, punitive, consequential or any other damages (including lost profits) even if notified of such damages.

Heartland Advisors defines market cap ranges by the following indices: micro-cap by the Russell Microcap®, small-cap by the Russell 2000®, mid-cap by the Russell Midcap®, large-cap by the Russell Top 200®.

Because of ongoing market volatility, performance may be subject to substantial short-term changes.

Dividends are not guaranteed and a company’s future ability to pay dividends may be limited. A company currently paying dividends may cease paying dividends at any time.

There is no assurance that dividend-paying stocks will mitigate volatility.

Russell Investment Group is the source and owner of the trademarks, service marks and copyrights related to the Russell Indices. Russell® is a trademark of the Frank Russell Investment Group.

Data sourced from FactSet: Copyright 2024 FactSet Research Systems Inc., FactSet Fundamentals. All rights reserved.

Artificial intelligence (AI) is intelligence—perceiving, synthesizing, and inferring information—demonstrated by computers, as opposed to intelligence displayed by humans or by other animals. Beta is provided by Russell Analytics. When calculating these measurements for the Fund, we have substituted the Fund's benchmark index as the "market return". Earnings Before Interest, Taxes, Depreciation and Amortization (EBITDA) measures a company’s financial performance. It is used to analyze and compare profitability between companies and industries because it eliminates the effects of financing and accounting decisions. Enterprise Value/Sales Ratio is a financial indicator used to determine the value of a company including debt. It is equal to a company’s Enterprise Value divided by its annual sales. Federal Funds Rate is the interest rate at which a depository institution lends funds maintained at the Federal Reserve to another depository institution overnight. Free Cash Flow is the amount of cash a company has after expenses, debt service, capital expenditures, and dividends. The higher the free cash flow, the stronger the company’s balance sheet. Inflation Risk is the possibility that the value of assets or income will decrease as inflation shrinks the purchasing power of a currency. Margin of Safety is a principle of investing in which an investor only purchases securities when the market price is significantly below its intrinsic value. NASDAQ Composite Index is the market capitalization-weighted index of approximately 3,000 common equities listed on the NASDAQ stock exchange and includes all Nasdaq-listed stocks that are not derivatives, preferred shares, funds, exchange-traded funds (ETFs) or debenture securities. Price/Earnings Ratio of a stock is calculated by dividing the current price of the stock by its trailing or its forward 12 months’ earnings per share. Treasury Bill (T-Bill) is a short-term debt obligation backed by the U.S. government with a maturity of less than one year. T-bills are sold in denominations of $1,000 up to a maximum purchase of $5 million and commonly have maturities of one month (four weeks), three months (13 weeks) or six months (26 weeks). Risk on/Risk off Theory is an investment setting in which price behavior responds to, and is driven by, changes in investor risk tolerance. Risk-on risk-off refers to changes in investment activity in response to global economic patterns. During periods when risk is perceived as low, risk-on risk-off theory states that investors tend to engage in higher-risk investments. When risk is perceived as high, investors have the tendency to gravitate toward lower-risk investments. Russell Investment Group is the source and owner of the trademarks, service marks and copyrights related to the Russell Indices. Russell® is a trademark of the Russell Investment Group. Russell 1000® Index measures the performance of the large-cap segment of the U.S. equity universe. It is a subset of the Russell 3000® Index and includes approximately 1000 of the largest securities based on a combination of their market cap and current index membership. The Russell 1000® represents approximately 92% of the U.S. market. Russell 2000® Value Index measures the performance of those Russell 2000® companies with lower price/book ratios and lower forecasted growth characteristics. Sell-Side Analyst is an individual who typically works for a brokerage firm and evaluates companies for future earnings growth and other investment criteria. They sometimes place recommendations on stocks or other securities, typically phrased as "buy", "sell", or "hold." S&P 500 Index is an index of 500 U.S. stocks chosen for market size, liquidity and industry group representation and is a widely used U.S. equity benchmark. All indices are unmanaged. It is not possible to invest directly in an index. 10 Principles of Value Investing™ consist of the following criteria for selecting securities: (1) catalyst for recognition; (2) low price in relation to earnings; (3) low price in relation to cash flow; (4) low price in relation to book value; (5) financial soundness; (6) positive earnings dynamics; (7) sound business strategy; (8) capable management and insider ownership; (9) value of company; and (10) positive technical analysis.

Heartland’s investing glossary provides definitions for several terms used on this page.

top