See standardized performance at the end.
“Nobody can predict interest rates, the future direction of the economy or the stock market. Dismiss all such forecasts and concentrate on what's actually happening to the companies in which you've invested."
— Peter Lynch
In the third quarter, attention shifted away from the AI trade as macroeconomic themes and geopolitical worries reemerged as key market drivers. Concerns over rising Treasury yields, elevated oil prices, and the potential start of a Fed rate-hiking cycle slowed the small-stock resurgence that had been gaining momentum. For the quarter, the Russell 2000® Value Index sank 4.91%, compared to the 2.30% gain for the S&P 500.
However, it’s important to keep a few things in perspective. For starters, we agree with Peter Lynch that it’s futile to try and forecast the direction of interest rates and other macro factors in hopes of predicting short-term market behavior. For us, our time is better spent analyzing the companies we own or assessing potential new investments to consider. Put another way, bottom-up research trumps top-down theories.
Also, if we’ve learned anything this year, it’s that three months doesn’t make a trend. While small stocks lagged in the quarter, the Russell 2000® Value is still outperforming the S&P 500 on a year-to-date basis, +16.96% versus +12.75%. In addition, the backdrop for value investing is improving. Rising interest rates, which have been viewed as a potential headwind for small caps, are starting to force investors to think more about valuations as equities face stiffer competition for investment dollars.
The good news is that small caps continue to enjoy a sizeable valuation advantage over large stocks. As the chart below shows, the S&P Small Cap 600 Index, using consensus Price/Earnings ratios for the next twelve months, is trading at a substantial discount to the S&P 500.
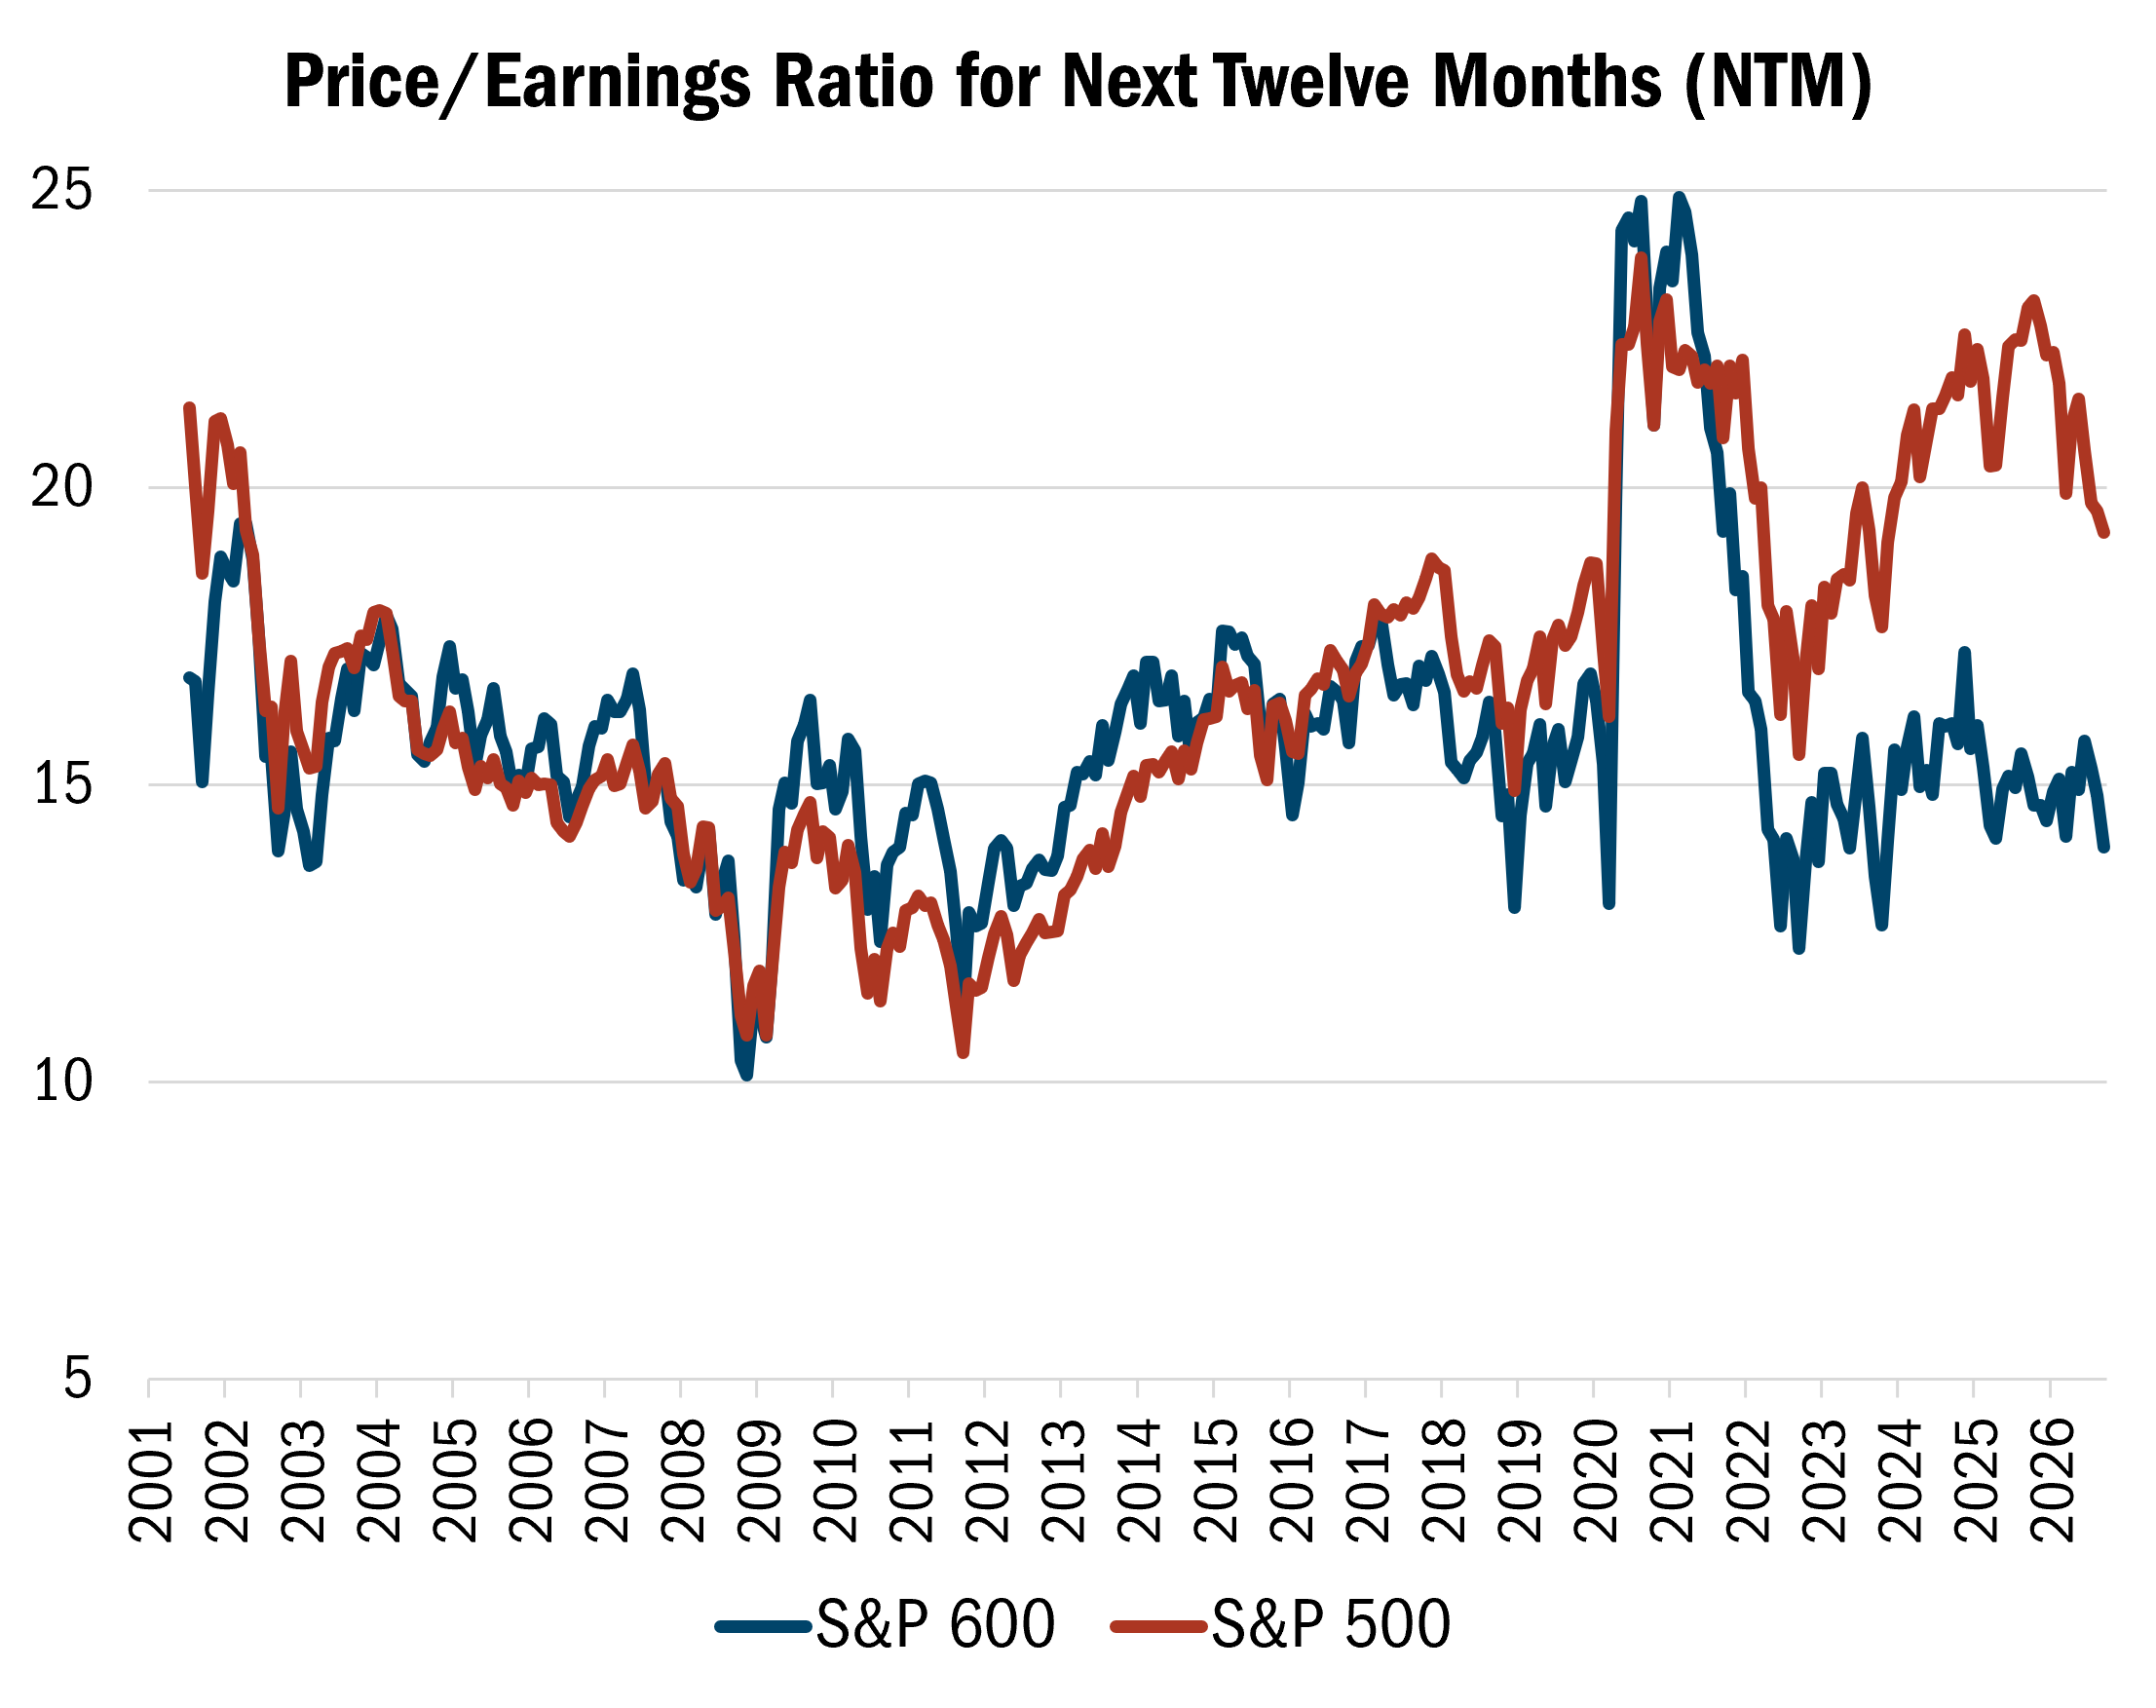
Source: FactSet Research Systems, Inc., Monthly data 7/31/2001 to 9/29/2026. This chart represents the comparison of the NTM P/E (next twelve-month price to earnings) for the S&P 600 Index versus the S&P 500 Index. S&P 500 Index is an index of 500 U.S. stocks chosen for market size, liquidity and industry group representation and is a widely used U.S. equity benchmark. S&P 600 Index is an index of small-cap stocks managed by Standard & Poor's. All indices are unmanaged. It is not possible to invest directly in an index. All indices are unmanaged. It is not possible to invest in an index. Past performance does not guarantee future results.
Importantly, the Heartland Value Fund trades at only 11X the next twelve months’ profits, for an earnings yield (the inverse of the price/earnings ratio) of 9%. That’s compared to the 5.2% on 10-Year Treasuries and the 6-7% payout for corporate bonds. By contrast, the S&P 500 is at 5.3%. This creates a favorable environment for active, valuation driven small-cap investors. In our opinion, we are well positioned to take advantage of market disparities because of our adherence to the 10 Principles of Value Investing™, which requires that fundamental factors such as strong balance sheets, profitable growth, and attractive valuations drive all of our portfolio decisions.
We’re mindful that the market continues to be fickle and unpredictable. We’ve been doing this long enough to understand this renewed focus on fundamentals may not persist. This is why a key element of our approach is to plan for a wide range of potential outcomes. For every investment we hold or consider owning, we establish four separate price targets: a base case, an upside scenario, a downside development, and a max loss circumstance associated with severe business stress. This approach is as useful to us now, after our benchmark hit a speedbump during the quarter, as it was earlier in the year, when investors’ appetite for small stocks rebounded sharply.
In the third quarter, the Heartland Value Fund fell 6.96%, compared to the 4.91% loss for the Russell 2000® Value Index. Security selection was mixed, with positive effects in Health Care, Materials, and Communication Services but negative results in Energy, Industrials, and Technology.
Within Energy, part of our underperformance was based on what we don’t own—we are under-exposed to pure-play refiners, which have recently been among the market’s best performers. In Industrials, a few holdings were impacted by the AI trade, as companies that were viewed as winners of the data center buildout earlier in the year were punished in the period, as AI interest waned.
Against this backdrop, it seems prudent to take what the market is giving us while derisking some positions that saw rapid appreciation earlier in the year. It also makes sense to focus on what we do best: identifying well-run businesses priced well below their intrinsic worth. In the third quarter, one of our companies was taken private, bringing the total number of holdings acquired in 2026 to seven. We view this as validation of our disciplined investment process.
One of our holdings receiving strategic interest is Integer Holdings (ITGR), a leading global medical device contract development and manufacturing organization (CDMO). A year ago, the stock sank more than 30% after reporting disappointing results and lowering guidance for growth and margin expansion this year. Yet bolstered by our research and insider buying we remained confident in the business. Also at year-end, a significant investor built a stake in the company and urged management to explore a sale. In the third quarter, KKR agreed to acquire ITGR for $127 a share, which was in line with our target price and represented a greater than 70% premium to our average cost.
A good example of our focus on valuations—and the value of active management—is Academy Sports and Outdoors (ASO). In the summer, we added to our position in this $6 billion in sales retailer, after rival Dick’s Sporting Goods missed badly on its second quarter earnings. That news sent the whole group down.
But Dick’s issues stemmed largely from its footwear business, and shoes represent a much smaller portion of Academy’s business. At the same time, ASO has meaningful exposure to outdoor recreation, a category that’s begun to pick up following years of weakness. There are also company-specific catalysts to drive improvement such as revamping of its e-commerce business, launching a new credit card, growing its loyalty program, and continuing to expand merchandising for higher income consumers.
In September, the stock surged after Academy reported Q2 results that were stronger than investors had feared. Despite this, ASO is valued at just 7X this year’s earnings and 7X next. Giving us even more confidence is management’s use of strong free cash flow to repurchase 40% of ASO shares outstanding since Academy went public in 2020.
A recently added holding is Hillman Solutions (HLMN). If you walk into your favorite hardware store and go to the fasteners’ aisle for items such as nuts, screws, and bolts, there’s a high likelihood it was sourced, supplied, and managed by Hillman. Fasteners are an important section of any home-improvement store because they drive traffic. Yet they are complex to manage due to the high number of individual items. Hillman has a team of dedicated associates that work with retailers to keep shelves inventoried and presentable, thus creating sticky partnerships and higher margins.
High interest rates have depressed demand for home repairs and remodeling among Hillman’s core customer, the do-it-yourself crowd. Foot traffic at Lowe’s and Ace Hardware—HLMN’s top two retailers—have been choppy as well, weighing on its stock price.
While it is hard to know when interest rates will be more favorable or when repair and remodel demand will improve, Hillman is driving growth in other areas, which should help it stand out versus its peers. HLMN, for instance, recently launched a new emphasis on top customers in the Pro channel, an opportunity which could drive 1-2% of annual top-line growth. Additionally, management made an acquisition that gives them a beachhead to expand in the Industrial fastener space.
The stock currently trades at less than 6.5X next year’s EBITDA, well below distributors in the Industrial sector. In fact, over the past two decades, Hillman has been sold to private equity firms twice, at 10-11X EBITDA. We forecast HLMN can achieve similar pricing once housing demand improves and management executes on the organic growth opportunities.
If there ever was a time for active management, this is it. While the past three months may have been challenging for our part of the market, the underlying backdrop for disciplined stock-picking has noticeably improved. As rates have risen and competition for investment dollars has grown, investors now care more about fundamentals and valuations. This is creating potential risk-versus-reward opportunities for our Strategy. It’s important to recognize, though, that not all companies in our benchmark are poised to outperform. This is why our 10 Principles of Value Investing™ are crucial to identifying fundamentally sound and attractively priced businesses with growth potential. We are excited about what lies ahead.
Fundamentally yours,
The Heartland Investment Team
Scroll over to view complete data
| Since Inception (%) | 20-Year (%) | 15-Year (%) | 10-Year (%) | 5-Year (%) | 3-Year (%) | 1-Year (%) | YTD* (%) | QTD* (%) | |
|---|---|---|---|---|---|---|---|---|---|
| Value Investor Class | 11.53 | 7.58 | 10.57 | 10.52 | 12.07 | 20.55 | 19.95 | 16.90 | -6.96 |
| Value Institutional Class | 11.61 | 7.75 | 10.74 | 10.68 | 12.23 | 20.73 | 20.14 | 17.05 | -6.92 |
| Russell 2000® Value | 10.72 | 7.58 | 11.38 | 9.40 | 7.80 | 17.93 | 20.77 | 16.96 | -4.91 |
*Not annualized
Source: FactSet Research Systems Inc., Russell®, and Heartland Advisors, Inc.
The inception date for the Value Fund is 12/28/1984 for the investor class and 5/1/2008 for the institutional class.
In the prospectus dated 5/1/2026, the Gross Fund Operating Expenses for the investor and institutional classes of the Value Fund are 1.09% and 0.94%, respectively.
Past performance does not guarantee future results. Performance represents past performance; current returns may be lower or higher. Performance for institutional class shares prior to their initial offering is based on the performance of investor class shares. The investment return and principal value will fluctuate so that an investor's shares, when redeemed, may be worth more or less than the original cost. All returns reflect reinvested dividends and capital gains distributions, but do not reflect the deduction of taxes that an investor would pay on distributions or redemptions. Subject to certain exceptions, shares of a Fund redeemed or exchanged within 10 days of purchase are subject to a 2% redemption fee. Performance does not reflect this fee, which if deducted would reduce an individual's return. To obtain performance through the most recent month end, call 800-432-7856 or visit heartlandadvisors.com.


©2026 Heartland Advisors | 790 N. Water Street, Suite 1200, Milwaukee, WI 53202 | Business Office: 414-347-7777 | Financial Professionals: 888-505-5180 | Individual Investors: 800-432-7856
In the prospectus dated 5/1/2026, the Gross Fund Operating Expenses for the investor and institutional classes of the Value Fund are 1.09% and 0.94%, respectively.
Past performance does not guarantee future results. Performance represents past performance; current returns may be lower or higher. Performance for institutional class shares prior to their initial offering is based on the performance of investor class shares. The investment return and principal value will fluctuate so that an investor's shares, when redeemed, may be worth more or less than the original cost. All returns reflect reinvested dividends and capital gains distributions, but do not reflect the deduction of taxes that an investor would pay on distributions or redemptions. Subject to certain exceptions, shares of a Fund redeemed or exchanged within 10 days of purchase are subject to a 2% redemption fee. Performance does not reflect this fee, which if deducted would reduce an individual's return. To obtain performance through the most recent month end, call 800-432-7856 or visit heartlandadvisors.com.
An investor should consider the Funds’ investment objectives, risks, and charges and expenses carefully before investing or sending money. This and other important information may be found in the Funds' prospectus. To obtain a prospectus, please call 800-432-7856 or visit heartlandadvisors.com. Please read the prospectus carefully before investing.
As of 9/30/2026 Academy Sports and Outdoors, Inc. (ASO), Hillman Solutions Corporation (HLMN), Integer Holdings Corporation (ITGR), represented 2.13%, 0.70%, and 1.96% of the Value Fund’s net assets, respectively. DICK'S Sporting Goods, Inc. (DKS) and KKR & Co Inc. (KKR) are unowned by Heartland Advisors, Inc.
Statements regarding securities are not recommendations to buy or sell.
Portfolio holdings are subject to change. Current and future portfolio holdings are subject to risk.
The Value Fund invests primarily in small companies selected on a value basis. Such securities generally are more volatile and less liquid than those of larger companies.
Value investments are subject to the risk that their intrinsic value may not be recognized by the broad market.
The Value Fund seeks long-term capital appreciation through investing in small companies.
The Fund’s performance information included in regulatory filings includes a required index that represents an overall securities market (Regulatory Benchmark). In addition, the Fund's regulatory filings may also include an index that more closely aligns to the Fund's investment strategy (Strategy Benchmark(s)). The Fund's performance included in marketing and advertising materials and information other than regulatory filings is generally compared only to the Strategy Benchmark.
The above individuals are registered representatives of ALPS Distributors, Inc.
The Heartland Funds are distributed by ALPS Distributors, Inc.
The statements and opinions expressed in this article are those of the presenter(s). Any discussion of investments and investment strategies represents the presenters’ views as of the date created and are subject to change without notice. The opinions expressed are for general information only and are not intended to provide specific advice or recommendations for any individual. The specific securities discussed, which are intended to illustrate the advisor’s investment style, do not represent all of the securities purchased, sold, or recommended by the advisor for client accounts, and the reader should not assume that an investment in these securities was or would be profitable in the future. Certain security valuations and forward estimates are based on Heartland Advisors’ calculations. Any forecasts may not prove to be true.
Economic predictions are based on estimates and are subject to change.
There is no guarantee that a particular investment strategy will be successful.
Sector and Industry classifications are sourced from GICS®.The Global Industry Classification Standard (GICS®) is the exclusive intellectual property of MSCI Inc. (MSCI) and S&P Global Market Intelligence (“S&P”). Neither MSCI, S&P, their affiliates, nor any of their third party providers (“GICS Parties”) makes any representations or warranties, express or implied, with respect to GICS or the results to be obtained by the use thereof, and expressly disclaim all warranties, including warranties of accuracy, completeness, merchantability and fitness for a particular purpose. The GICS Parties shall not have any liability for any direct, indirect, special, punitive, consequential or any other damages (including lost profits) even if notified of such damages.
Heartland Advisors defines market cap ranges by the following indices: micro-cap by the Russell Microcap®, small-cap by the Russell 2000®, mid-cap by the Russell Midcap®, large-cap by the Russell Top 200®.
Because of ongoing market volatility, performance may be subject to substantial short-term changes.
Dividends are not guaranteed and a company’s future ability to pay dividends may be limited. A company currently paying dividends may cease paying dividends at any time.
There is no assurance that dividend-paying stocks will mitigate volatility.
Russell Investment Group is the source and owner of the trademarks, service marks and copyrights related to the Russell Indices. Russell® is a trademark of the Frank Russell Investment Group.
Data sourced from FactSet: Copyright 2026 FactSet Research Systems Inc., FactSet Fundamentals. All rights reserved.
Artificial intelligence (AI) is intelligence—perceiving, synthesizing, and inferring information—demonstrated by computers, as opposed to intelligence displayed by humans or by other animals. Bottom-up is an investment approach that de-emphasizes the significance of economic and market cycles. This approach focuses on the analysis of individual stocks and the investor focuses his or her attention on a specific company rather than on the industry in which that company operates or on the economy as a whole. Earnings Before Interest, Taxes, Depreciation and Amortization (EBITDA) measures a company’s financial performance. It is used to analyze and compare profitability between companies and industries because it eliminates the effects of financing and accounting decisions. Federal Funds Rate is the interest rate at which a depository institution lends funds maintained at the Federal Reserve to another depository institution overnight. Momentum is the rate of acceleration of a security's price or trade volume. Price/Earnings Ratio (12-month trailing) of a stock is calculated by dividing the current price of the stock by its trailing 12 months' earnings per share. Russell Investment Group is the source and owner of the trademarks, service marks and copyrights related to the Russell Indices. Russell® is a trademark of the Russell Investment Group. Russell 2000® Value Index measures the performance of those Russell 2000® companies with lower price/book ratios and lower forecasted growth characteristics. All indices are unmanaged. It is not possible to invest directly in an index. S&P 500 Index is an index of 500 U.S. stocks chosen for market size, liquidity and industry group representation and is a widely used U.S. equity benchmark. All indices are unmanaged. It is not possible to invest directly in an index. S&P 600 Index is an index of small-cap stocks managed by Standard & Poor's. It tracks a broad range of small-sized companies that meet specific liquidity and stability requirements. This is determined by specific metrics such as public float, market capitalization, and financial viability, among other factors. Treasury Yield is the effective rate of interest paid on a debt obligation issued by the U.S. Treasury for a specified term. Upside Capture/Downside Capture vs. Market is a measure used to evaluate how well a manager or index performed (gained more or lost less) relative to another index during periods when that index rose or fell. Market is defined as the X Index. 10 Principles of Value Investing™ consist of the following criteria for selecting securities: (1) catalyst for recognition; (2) low price in relation to earnings; (3) low price in relation to cash flow; (4) low price in relation to book value; (5) financial soundness; (6) positive earnings dynamics; (7) sound business
Heartland’s investing glossary provides definitions for several terms used on this page.