See standardized performance at the end.
"Anyone who isn’t confused really doesn’t understand the situation.”
— Edward R. Murrow
Earnings for companies in the small cap S&P 600 Index have finally begun to rebound. This comes just as the Federal Reserve started to cut short-term interest rates. Historically, both developments have been tailwinds for small stocks, lending credence to our sense of optimism throughout the year. Yet we’ve been doing this long enough to know that there’s never an all-clear signal given by the markets.
Consider the mixed signals the market has been sending lately. For instance, more than half of all U.S. industries have been shedding jobs, which historically has been a precursor for a recession. But the broad market, which is itself a leading indicator of the health of the economy, has been hitting new highs, driven in part by optimism surrounding artificial intelligence (AI). Similarly, if you were to just look at the ISM Manufacturing Purchasing Managers’ Index, you’d think that the Industrial sector has been contracting for nearly three years. Yet Caterpillar, one of the world’s leading makers of construction equipment, has been on a record run, which is a bit of a headscratcher.
Then there’s small company confidence. Traditionally, small-cap outperformance coincides with rising business optimism, as measured by a survey tracked by the National Federation of Independent Business. Emerging from past recessions in 2009 and 2020, improving sentiment was followed by strong rallies in the Russell 2000® Value Index. Until recently, that’s not been the case this year, though a significant rally seems to be underway (see the chart below).
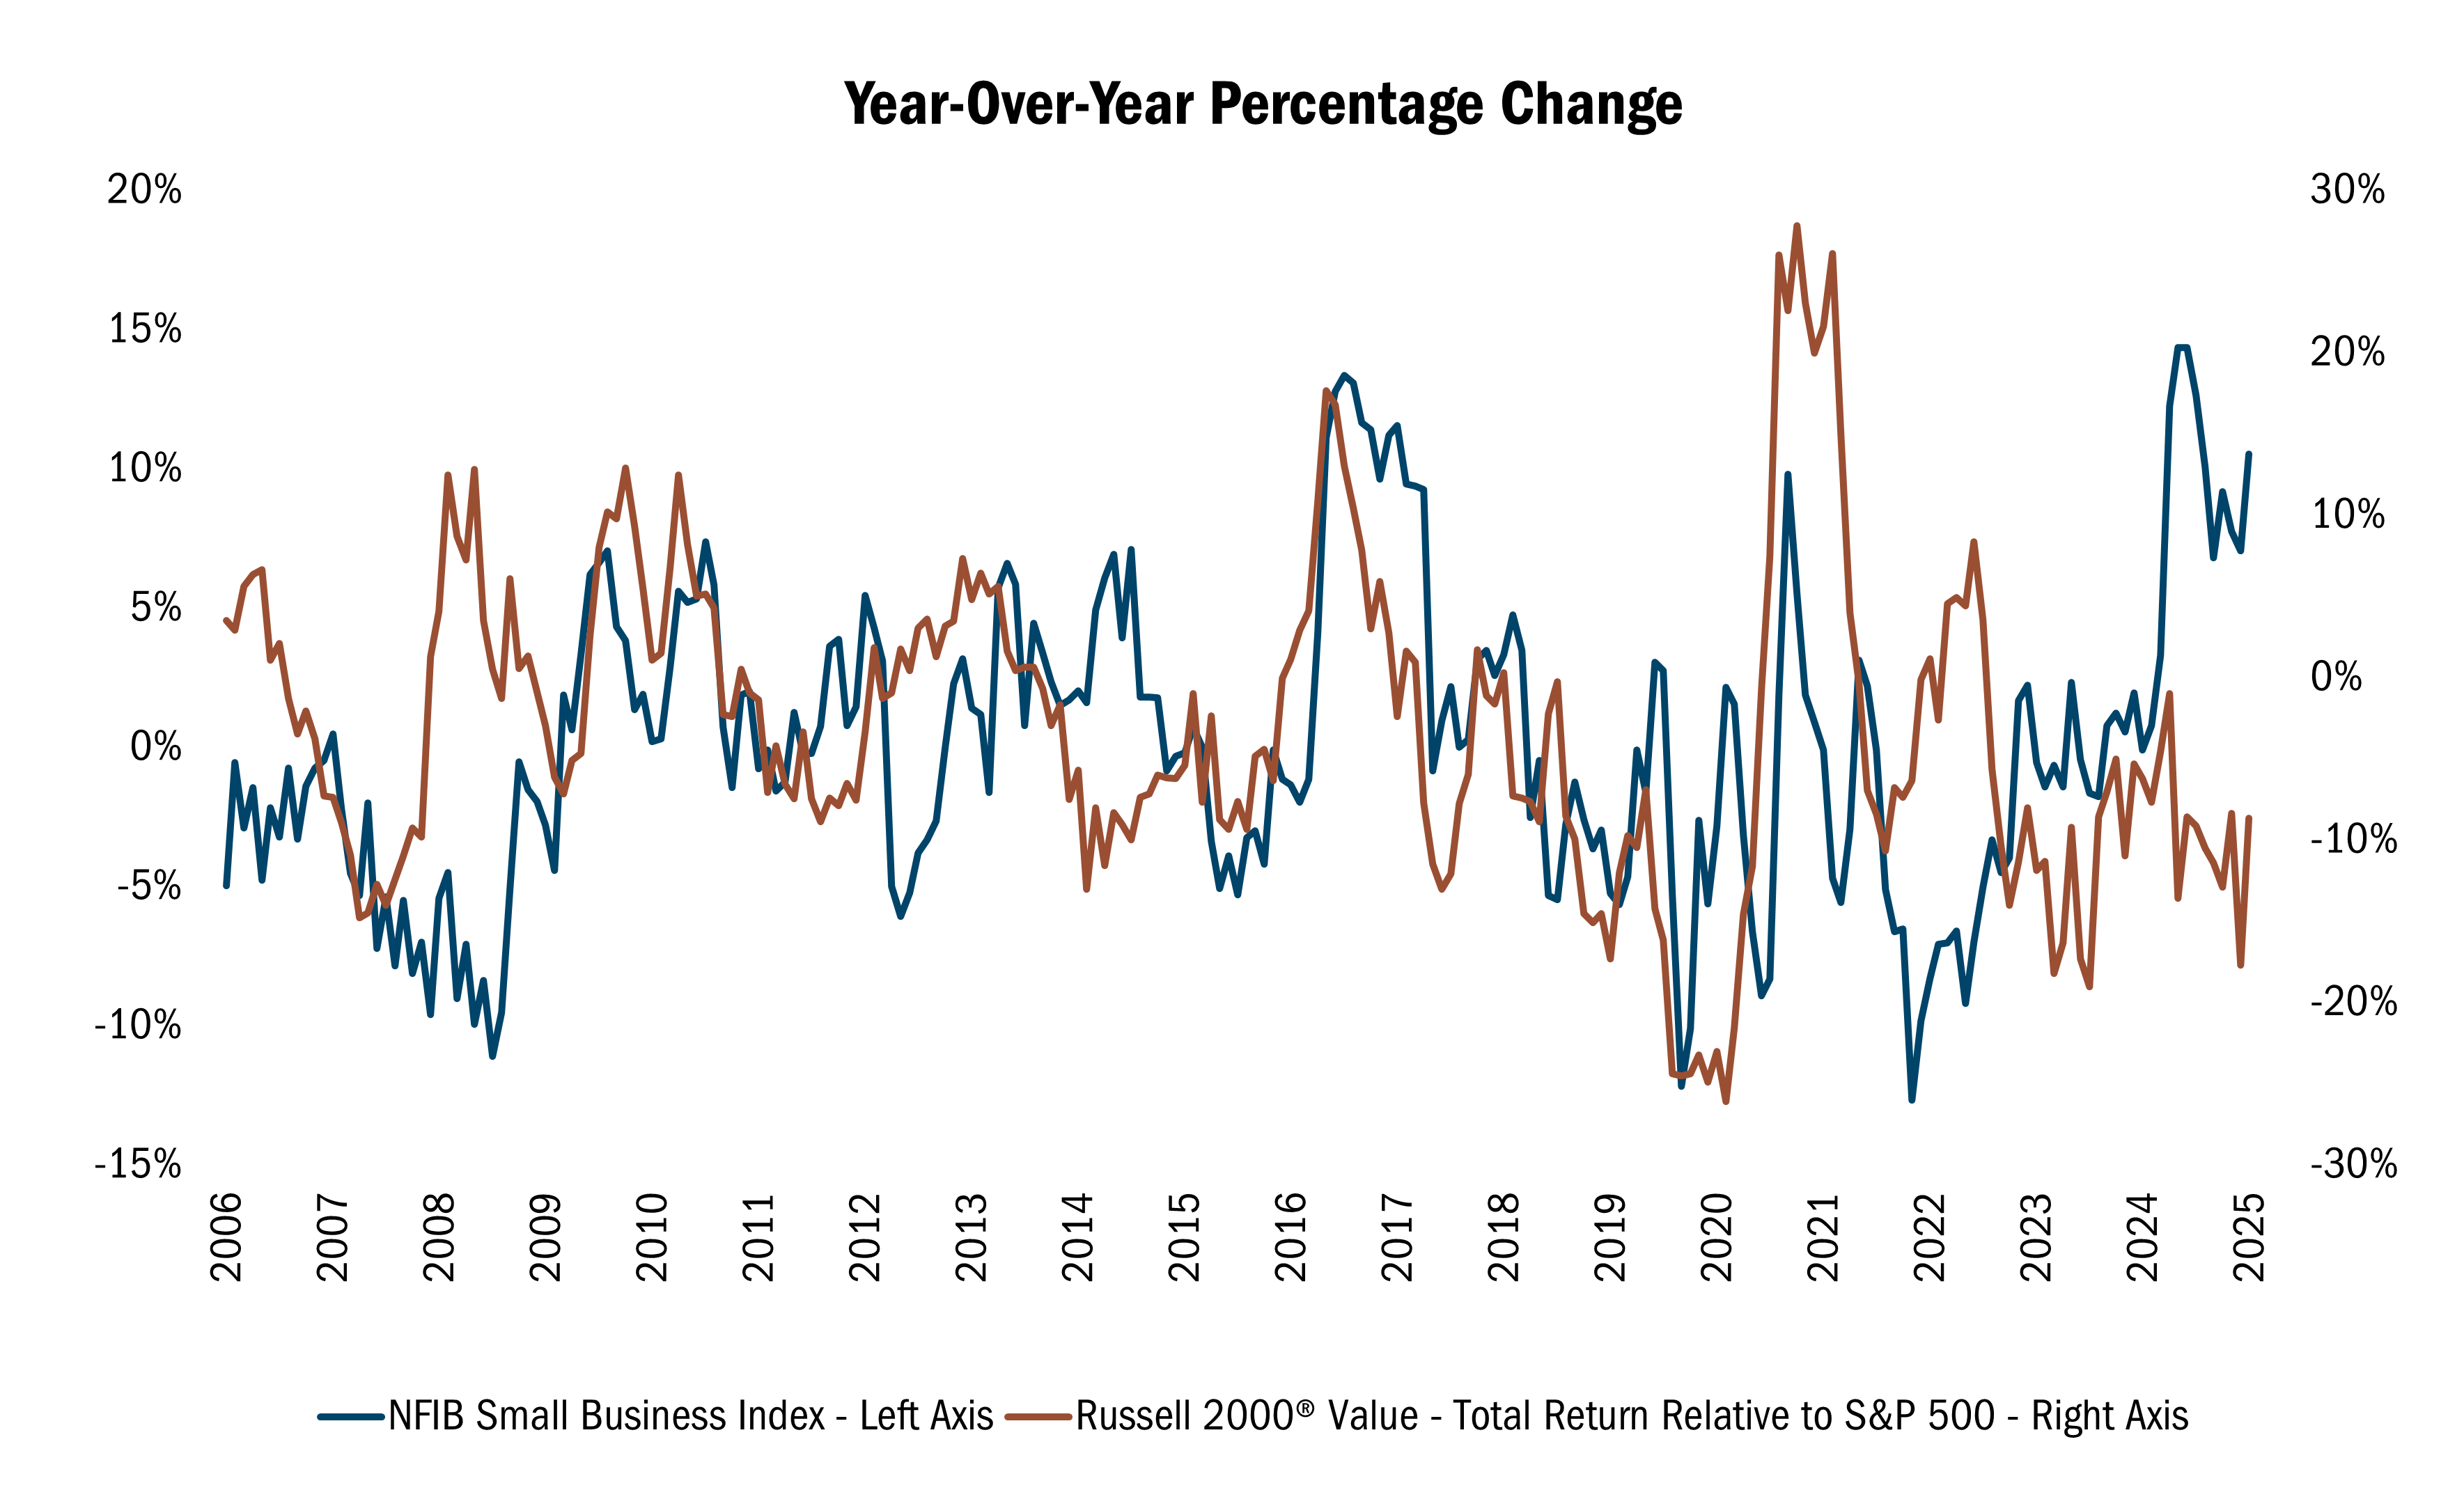
Source: FactSet Research Systems Inc. Monthly data from 8/31/2005 to 8/29/2025. The data in this chart represents a year-over-year percentage change in the NFIB Small Business Index compared to the Total Return of the Russell 2000® Value Index relative to the S&P 500 Index. Russell 2000® Value Index measures the performance of those Russell 2000® companies with lower price/book ratios and lower forecasted growth characteristics. NFIB Small Business Optimism Index is a small business optimism index compiled from a survey that is conducted each month by the National Federation of Independent Business (NFIB) of its members. The index is a composite of ten seasonally adjusted components based on questions on the following: plans to increase employment, plans to make capital outlays, plans to increase inventories, expect economy to improve, expect real sales higher, current inventory, current job opening, expected credit conditions, now a good time to expand, and earnings trend. S&P 500 Index is an index of 500 U.S. stocks chosen for market size, liquidity and industry group representation and is a widely used U.S. equity benchmark. All indices are unmanaged. It is not possible to invest directly in an index. Past performance does not guarantee future results.
All of this evokes the words of Edward R. Murrow: "Anyone who isn’t confused really doesn’t understand the situation.” For us, this is a reminder that no matter how optimistic we might be about the current circumstances for small value, our attention must be constantly directed inward on things that are controllable and improvable.
For example, one of the easiest ways for us to address conflicting signals is to plan for as wide a range of outcomes as possible. This is why we establish four price targets for every company under consideration. One price reflects expectations under the best circumstances. Another is established around our base-case scenario. A third focuses on potential downside risks. The fourth centers on how much the stock might drop under the worst outcomes.
Going through this exercise helps prepare us for a potential change in circumstances. We try to build in an even greater margin of safety by relying on the 10 Principles of Value Investing™, which emphasizes attractively priced, well-run companies with strong balance sheets, sound business strategies and promising earnings catalysts. These factors serve as the guiding principles for the Firm’s investment strategy and have led the Value Fund to benchmark-beating performance since it was launched in 1984.
For the quarter, the Heartland Value Fund gained 10.04%, compared with the 12.60% return for the Russell 2000® Value Index. The Strategy has outperformed its benchmark on a year-to-date basis as well as over the past one, three, five, and 10 years and since inception.
Stock picking was negative in 5 of 11 sectors, led by underperformance in Health Care, Communication Services, and Utilities. Over the past one, three, and five years, however, security selection accounted for almost all the Fund’s outperformance.
As value investors in a richly priced equity market that’s dominated by passivity and investors’ love affair with AI, we are able, remarkably, to uncover solid businesses priced at attractive valuations. Many are leaders in their respective industries, overlooked by the momentum crowd. Our focus remains on the 10 Principles of Value Investing™, which have stood the test of time. If this can be bolstered by macro tailwinds, all the better. But the investment process starts with fundamentally driven, bottoms-up stock research.
A good example is Potbelly (PBPB), the sub sandwich chain which had been a long-term winner for us before it was acquired during the quarter by the convenience store operator RaceTrac at a +32% premium.
We first purchased Potbelly in March 2021, a time when the environment for the restaurant sector was uncertain with depressed sales coming out of COVID-19 lock-downs. It was the fundamentals and strong insider buying that caught our attention. The new CEO at the time, Bob Wright, came out of retirement to turn around a strong brand that had been mismanaged and was no longer growing. He had a long career in restaurants including prior stints as chief operating officer of Wendy’s and as chief executive officer of Charley’s Cheesesteaks. He surrounded himself with an executive team that had successful restaurant careers, many of whom he worked with in prior roles.
The team focused on improving operations through a long list of initiatives. The efforts resulted in consistent same-store growth above restaurant peers and a structural improvement in margins. With operations stabilized, Potbelly is pivoting to growth mode with a target of 2,000 shops from its current footprint of 454. The transformation from a mismanaged restaurant company to a fast-growing franchise worth acquiring proved fruitful for investors.
Another industry leader that caught our attention in early 2024 is Calavo (CVGW), which is headquartered in Santa Paula, California. Their unique health-conscious food products were intriguing, but they were in the midst of a management transition, so it was put on our watch list. After a series of research calls uncovering an improving outlook, we began to accumulate the stock early this year.
CVGW is a leading marketer and distributor of avocados and guacamole. After a multi-year period of mismanagement that included several CEOs, the long-time former chief executive came out of retirement to stabilize operations. He is aligned with shareholders receiving large equity grants that vest significantly higher than current stock levels and has purchased a sizeable number of shares in the open market.
Since returning to the business, he has focused on exiting low-margin business lines and growing the prepared guacamole business that was 10% of total sales last year but has double the gross margin of the core business. This business grew +40% YOY in the latest quarter. CVGW believes they can double the size of this business within the next two years, which would be fruitful for Calavo’s earnings potential. The evolving narrative positions Calavo less as a commodity-dependent packer and more as a growing “fresh + value-added” food company. If management can scale the prepared guacamole business, control costs, and navigate tax/regulatory risks, we believe shareholders will be rewarded.
We aren’t the only believers. Calavo received an unsolicited buyout offer for $32 a share in July. Further, the downside risk seems to be limited, supported by a solid balance sheet that includes around $3.50 per share of net cash plus $3 a share of cash potentially from the resolution of a long-standing dispute with Mexican tax authorities.
Last quarter, we discussed how management at Dentsply Sirona, Inc. (XRAY), one of the world’s leading suppliers of dental equipment and supplies, had been laying the groundwork for a turnaround for more than two years. Those efforts had yet to be reflected in the stock price.
In the third quarter, CEO Simon Campion stepped down after three years at the helm and was replaced by Daniel Scavilla. Under Campion, XRAY focused on SKU rationalization and other cost initiatives but failed to keep up with its peers in terms of top-line growth. CEO Scavilla has a record of sales success at Globus Medical Inc. and Johnson & Johnson. We are encouraged by his initial strategies to arm the sales force better to go to market with the company’s existing portfolio and near-term goals to improve margins and free cash flows.
Dentsply was among the Fund’s worst performers for the quarter, however trading at 6.7X estimated earnings, its valuation seems extremely discounted. Thus we will remain patient and sit tight with the position believing that the upside potential far outweighs the downside risk. However, our patience has a limit, and we will closely monitor XRAY’s progress.
The past quarter has confirmed our optimism about the improving opportunities for small cap value investors. However, it has also reinforced the importance of having the right process in place, regardless of circumstances. We believe sound security selection, informed by thorough research and implemented with process discipline, will guide performance, as it has been for more than 40 years.
Thank you for your loyalty and continued confidence.
Fundamentally yours,
The Heartland Investment Team
Scroll over to view complete data
Source: FactSet Research Systems Inc., Russell®, and Heartland Advisors, Inc.
The inception date for the Value Fund is 12/28/1984 for the investor class and 5/1/2008 for the institutional class.
©2026 Heartland Advisors | 790 N. Water Street, Suite 1200, Milwaukee, WI 53202 | Business Office: 414-347-7777 | Financial Professionals: 888-505-5180 | Individual Investors: 800-432-7856
In the prospectus dated 5/1/2026, the Gross Fund Operating Expenses for the investor and institutional classes of the Value Fund are 1.09% and 0.94%, respectively.
Past performance does not guarantee future results. Performance represents past performance; current returns may be lower or higher. Performance for institutional class shares prior to their initial offering is based on the performance of investor class shares. The investment return and principal value will fluctuate so that an investor's shares, when redeemed, may be worth more or less than the original cost. All returns reflect reinvested dividends and capital gains distributions, but do not reflect the deduction of taxes that an investor would pay on distributions or redemptions. Subject to certain exceptions, shares of a Fund redeemed or exchanged within 10 days of purchase are subject to a 2% redemption fee. Performance does not reflect this fee, which if deducted would reduce an individual's return. To obtain performance through the most recent month end, call 800-432-7856 or visit heartlandadvisors.com.
An investor should consider the Funds’ investment objectives, risks, and charges and expenses carefully before investing or sending money. This and other important information may be found in the Funds' prospectus. To obtain a prospectus, please call 800-432-7856 or visit heartlandadvisors.com. Please read the prospectus carefully before investing.
As of 9/30/2025, Calavo Growers, Inc. (CVGW), Dentsply Sirona, Inc. (XRAY), and Potbelly Corp. (PBPB), represented 0.82%, 1.03%, and 0.79% of the Value Fund’s net assets, respectively. Caterpillar, Inc. (CAT) is unowned by Heartland Advisors, Inc.
Statements regarding securities are not recommendations to buy or sell.
Portfolio holdings are subject to change. Current and future portfolio holdings are subject to risk.
The Value Fund invests primarily in small companies selected on a value basis. Such securities generally are more volatile and less liquid than those of larger companies.
Value investments are subject to the risk that their intrinsic value may not be recognized by the broad market.
The Value Fund seeks long-term capital appreciation through investing in small companies.
The above individuals are registered representatives of ALPS Distributors, Inc.
The Fund’s performance information included in regulatory filings includes a required index that represents an overall securities market (Regulatory Benchmark). In addition, the Fund's regulatory filings may also include an index that more closely aligns to the Fund's investment strategy (Strategy Benchmark(s)). The Fund's performance included in marketing and advertising materials and information other than regulatory filings is generally compared only to the Strategy Benchmark.
The Heartland Funds are distributed by ALPS Distributors, Inc.
The statements and opinions expressed in this article are those of the presenter(s). Any discussion of investments and investment strategies represents the presenters’ views as of the date created and are subject to change without notice. The opinions expressed are for general information only and are not intended to provide specific advice or recommendations for any individual. The specific securities discussed, which are intended to illustrate the advisor’s investment style, do not represent all of the securities purchased, sold, or recommended by the advisor for client accounts, and the reader should not assume that an investment in these securities was or would be profitable in the future. Certain security valuations and forward estimates are based on Heartland Advisors’ calculations. Any forecasts may not prove to be true.
Economic predictions are based on estimates and are subject to change.
There is no guarantee that a particular investment strategy will be successful.
Sector and Industry classifications are sourced from GICS®.The Global Industry Classification Standard (GICS®) is the exclusive intellectual property of MSCI Inc. (MSCI) and S&P Global Market Intelligence (“S&P”). Neither MSCI, S&P, their affiliates, nor any of their third party providers (“GICS Parties”) makes any representations or warranties, express or implied, with respect to GICS or the results to be obtained by the use thereof, and expressly disclaim all warranties, including warranties of accuracy, completeness, merchantability and fitness for a particular purpose. The GICS Parties shall not have any liability for any direct, indirect, special, punitive, consequential or any other damages (including lost profits) even if notified of such damages.
Heartland Advisors defines market cap ranges by the following indices: micro-cap by the Russell Microcap®, small-cap by the Russell 2000®, mid-cap by the Russell Midcap®, large-cap by the Russell Top 200®.
Because of ongoing market volatility, performance may be subject to substantial short-term changes.
Dividends are not guaranteed and a company’s future ability to pay dividends may be limited. A company currently paying dividends may cease paying dividends at any time.
There is no assurance that dividend-paying stocks will mitigate volatility.
Russell Investment Group is the source and owner of the trademarks, service marks and copyrights related to the Russell Indices. Russell® is a trademark of the Frank Russell Investment Group.
Data sourced from FactSet: Copyright 2026 FactSet Research Systems Inc., FactSet Fundamentals. All rights reserved.
Artificial intelligence (AI) is intelligence is perceiving, synthesizing, and inferring information—demonstrated by computers, as opposed to intelligence displayed by humans or by other animals. Book Value is the sum of all of a company’s assets, minus its liabilities. Bottom-up is an investment approach that de-emphasizes the significance of economic and market cycles. This approach focuses on the analysis of individual stocks and the investor focuses his or her attention on a specific company rather than on the industry in which that company operates or on the economy as a whole. Cash Per Share is calculated by dividing the free cash flow of a company by the number of shares outstanding. Free Cash Flow is the amount of cash a company has after expenses, debt service, capital expenditures, and dividends. The higher the free cash flow, the stronger the company’s balance sheet. ISM Manufacturing PMI (Purchasing Managers Index) is an index based on surveys of more than 400 manufacturing firms by the Institute for Supply Management (ISM). The PMI index is an indicator of the economic health of the manufacturing sector based on five major indicators: new orders, inventory levels, production, supplier deliveries and the employment environment. A reading over 50 represents that the industry is expanding, under 50 represents a contraction, while a reading at 50 represents no change. NFIB Small Business Survey is conducted monthly and drawn from the National Federation of Independent Business membership. The term "small business" is defined as an independent (not publicly-held or held by an entity that is publicly-held), for-profit enterprise that employs between 1 and 250 people, not including the owners. Tangible Book Value is the sum of all of a company’s assets, minus its liabilities and intangible assets, such as goodwill. Russell Investment Group is the source and owner of the trademarks, service marks and copyrights related to the Russell Indices. Russell® is a trademark of the Russell Investment Group. Russell 2000® Value Index measures the performance of those Russell 2000® companies with lower price/book ratios and lower forecasted growth characteristics. S&P 500 Index is an index of 500 U.S. stocks chosen for market size, liquidity and industry group representation and is a widely used U.S. equity benchmark. All indices are unmanaged. It is not possible to invest directly in an index. S&P 600 is an index of small-cap stocks managed by Standard & Poor's. It tracks a broad range of small-sized companies that meet specific liquidity and stability requirements. This is determined by specific metrics such as public float, market capitalization, and financial viability, among other factors. 10 Principles of Value Investing™ consist of the following criteria for selecting securities: (1) catalyst for recognition; (2) low price in relation to earnings; (3) low price in relation to cash flow; (4) low price in relation to book value; (5) financial soundness; (6) positive earnings dynamics; (7) sound business strategy; (8) capable management and insider ownership; (9) value of company; and (10) positive technical analysis.
Heartland’s investing glossary provides definitions for several terms used on this page.


