See standardized performance at the end.
“If everyone is thinking alike, then somebody isn’t thinking.”
— George S. Patton
The Russell 2000® Index rose 21.49% over the past three months, outpacing large stocks for the third time in the past four quarters. Normally, this would be seen as a sign the market is broadening out, which seems to be the case in many respects. Yet it’s also narrowing in one key regard, as the extreme winners appear to be only those companies considered the biggest beneficiaries of the AI boom.
Over the past year, more Nasdaq stocks have soared 400% or higher than since the dotcom bubble more than a quarter century ago, reflecting the herd mentality that’s driving this market. The irony is, while the crowd is fixated on the AI trade, there are ample opportunities we’re seeing throughout the small cap space for thoughtful investors willing to challenge conventional wisdom. But if there’s one distinguishing characteristic of a herd, it’s the dearth of reasoning. As General George S. Patton famously remarked, “If everyone is thinking alike, then somebody isn’t thinking.”
We’re not saying recent developments in artificial intelligence aren’t real or significant. AI will certainly displace large parts of the economy, changing how many of us live and do our jobs. However, we don’t believe the disruption will be as extreme as is currently being priced into many parts of the market. Nor do we believe the level of speculation associated with the boom is justified.
As the chart below shows, Americans are borrowing to invest at alarming levels. U.S. margin debt as a percentage of liquid assets—which includes checking and savings deposits, money market funds, and bank CDs—is higher than it’s been since the global financial crisis and is approaching levels not seen since the dotcom bubble.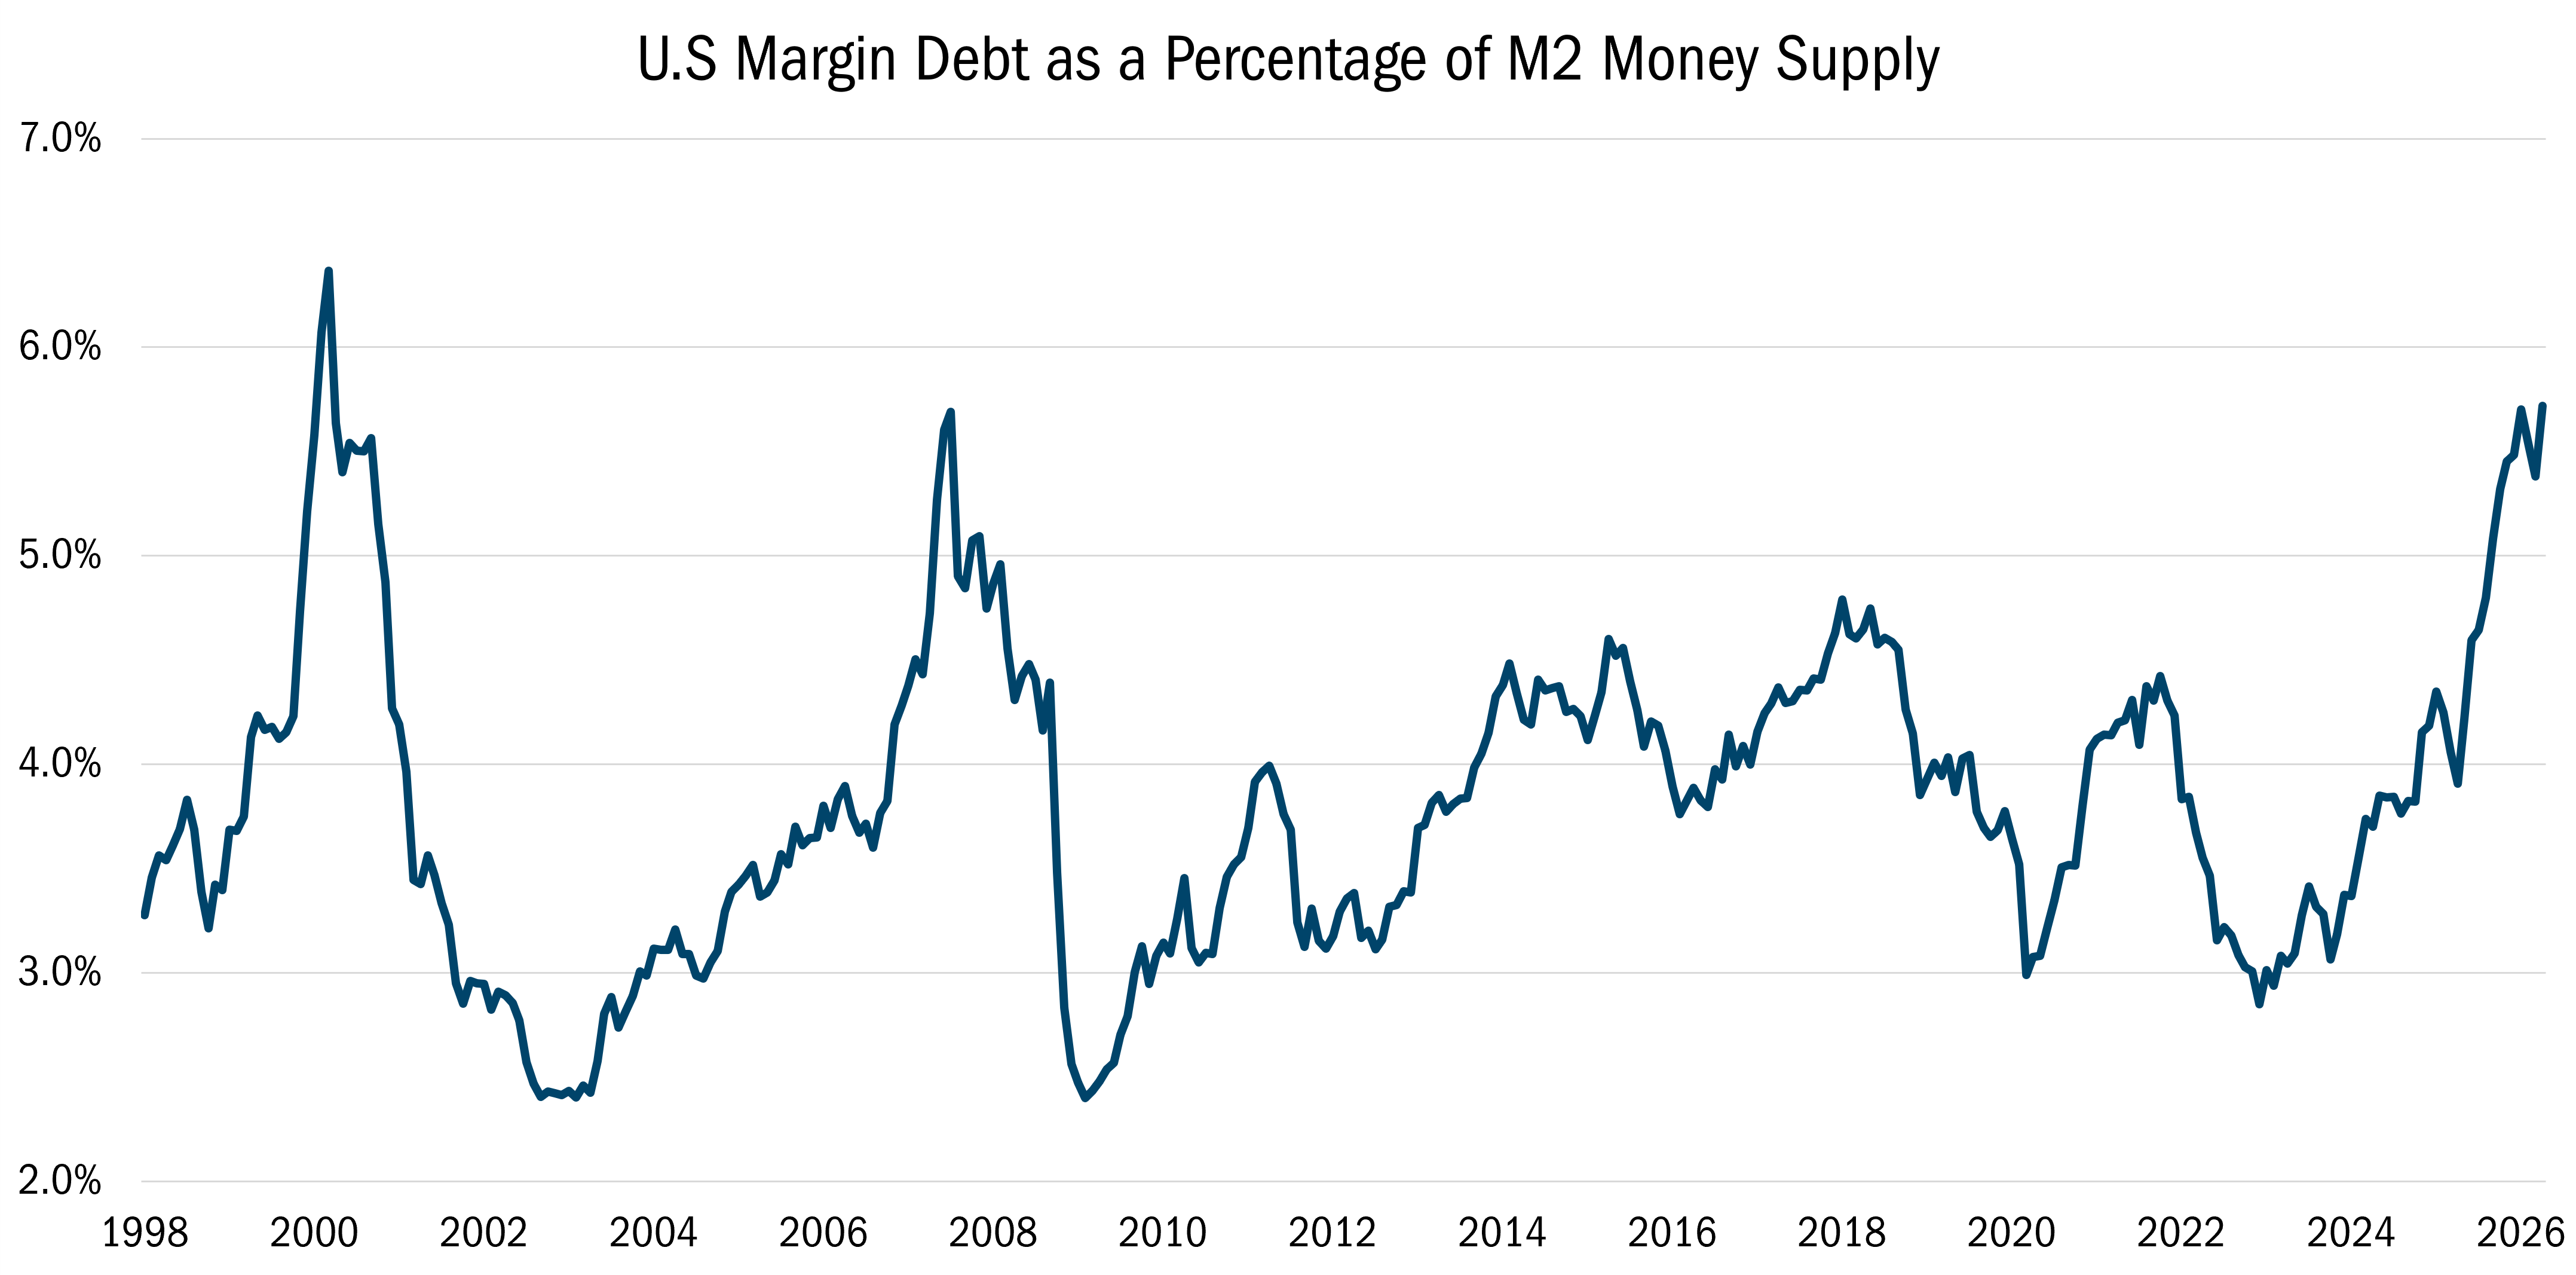
Source: FRED and FINRA. Monthly data from 1/1/1998 to 4/1/2026. The data in this chart shows U.S. investor margin debt as a percentage of the M2 money supply over time. All indices are unmanaged. It is not possible to invest in an index. Past performance does not guarantee future results.
This excessive risk taking is coming at the same time that insufficient attention appears to be focused on the fundamentals. At Heartland, by contrast, our 10 Principles of Value Investing™ require us to constantly focus on fundamental factors such as attractive valuations, strong balance sheets, and positive earnings dynamics. Those principles, which guide all our portfolio decisions, prevent us from following the herd and help us detect overlooked opportunities the crowd is ignoring.
In the second quarter, the Heartland Value Fund gained 17.05%, compared with the 17.19% return for the Russell 2000® Value Index. Part of that underperformance was attributable to security selection, which was negative in 6 of 11 sectors, led by Health Care, Information Technology, and Consumer Discretionary.
While the selection effect worked against us in Technology, our holdings in that sector still returned 67.52% during the quarter, compared with the 78.52% gains for our benchmark. Given the performance of that part of our portfolio and the euphoria surrounding AI, we’re not overly disappointed. In fact, we’re more than willing to trim our exposure whenever we believe the valuation characteristics are deteriorating.
Lately, we’ve also been reducing our exposure in Tech, for another reason. We choose to be sector aware, meaning we want our exposure to various industries to be within a range of the weightings of our benchmark. We do this to help ensure that bottom-up stock selection, not top-down allocation decisions, drives our returns. In June, the Russell 2000® Value underwent a semi-annual reconstitution in which Technology’s weighting in the Index fell from 12.16% to 7.58%.
At the same time, we’ve been finding plenty of segments of the market where the AI herd hasn’t been roaming. In the second quarter, we added to 51 of our existing positions across numerous sectors, including Energy, Financials, Health Care, Communications, Real Estate, and Industrials. When we do buy, we’re not simply deploying flows or chasing parts of the market that are making new highs. We are adding exposure in securities that we believe are attractively priced and still represent a good risk/reward balance.
A good example is Photronics (PLAB). Earlier this year, we reduced our stake in PLAB, a leading manufacturer of photomasks that are used to transfer circuit patterns onto semiconductor wafers and flat panel substrates during the fabrication process. The shares more than doubled from December to May, and we felt the stock was getting caught up in the mania surrounding the AI buildout, so we took some money off the table as it reached our price target.
Shortly thereafter, however, the stock dropped more than 40%. This extreme volatility created yet another chance for active, value-minded investors like us to reassess the new balance of reward versus risk.
PLAB is the largest merchant photomask maker, in an industry where roughly 60% of production is fulfilled in-house by the semiconductor companies themselves. Photronics spends 10-20% of its sales on capital expenditures annually, creating barriers to entry for other merchant competitors. We believe the company is now positioned to reap the benefits of several years of investments as new semiconductor design activity remains robust for higher-margin, ‘leading-edge’ applications, which are often tied to AI. Meanwhile, ‘trailing-edge’ semiconductor demand, levered to consumer electronics, industrial, and auto end markets, has also shown signs of rebounding after a period of tepid consumer spending and slowing industrial activity.
PLAB seems to be positioned to benefit from both developments. After the recent sell-off, the stock is trading at less than 16X projected earnings over the next 12 months, representing a discount to its peers. Meanwhile, Photronics has a strong balance sheet with $10.85 net cash per share and is positioned to steadily grow free cash flow, accelerate sales growth and improve margins. Net of cash, the P/E ratio is only 10.4X, remarkable for this industry leader.
While the herd mentality initially drove up PLAB shares on AI hopes, other companies have been overly punished by disruption fears. Case in point: i3 Verticals (IIIV), which makes enterprise software for the public sector, including school payment systems.
The shares slumped from around $34 last fall to below $20 in May over concerns that emerging automation and machine learning technologies are disrupting software stocks. In our view, these AI technologies are more likely to be a benefit than a disadvantage. The company has distinct advantages in data, domain expertise, and technical knowledge in a public sector environment that’s slow to adopt new technology. This dynamic creates a deeply embedded platform and secure relationships that i3 manages for customer workflows. In fact, management recently stated that customers will likely move at a slower pace for artificial intelligence adoption than IIIV is capable of delivering. Meanwhile, IIIV can deliver cost savings capabilities through its software that budget-strained public institutions need to do more with less.
We believe earnings per share should accelerate as recent investments in new applications roll out to customers and management executes on internal cost savings initiatives through automation. Moreover, IIIV’s consistent outlook for recurring revenue growth, margin expansion, and free-cash-flow generation makes it attractive to a potential strategic acquirer, which could be a strong possibility in coming years if the market fails to fully value shares. Yet the stock price is just 10.3X fiscal year 2026 EBITDA, which represents a steep discount to its largest peer, which trades at 17.1X despite similar growth and margins.
Another example of us splitting from the herd is in Utilities. The sector was one of our detractors when it came to security selection during the quarter. But many of these companies have been indirect beneficiaries of the AI infrastructure buildout and have seen their valuations climb. In our opinion, it does not make sense to take on AI-related risks in this part of the market especially given current Utility valuations.
An example of a traditional Utility that we favor and that is not related to AI play is Unitil (UTL), an interstate gas and electric company that serves the northern East Coast. Maine and New Hampshire are the two largest markets for homes heated by fuel oil in the U.S. In Maine, the high cost of powering homes is weighing on consumers, many of whom are considering switching to natural gas. If consumers switch, they could reduce their energy bills by around 45% or more.
Between 2018 and 2024, the number of Maine households relying on heating oil fell nearly 20%. This was accomplished through a mix of energy rebates for those who switched to high-efficiency heat pumps, as well as UTL offering a refund for those in their service territory who signed natural gas installation agreements. UTL and local governments continue to offer a mix of programs to assist with converting, and Maine is on track to meet its goal of cutting oil consumption by 50% by 2050. UTL also acquired Bangor Natural Gas and Maine Natural Gas for a total of around $11 million, increasing its gas customers by 6,400.
While this may not sound as exciting relative to the power needs of AI data centers, the stock is attractively priced at around 1.5 times book value, which represents a discount compared with the 2.0 multiple for its Utility peers.
UTL demonstrates that there are plenty of attractively priced, small-cap companies outside of Technology. So does Sonic Automotive (SAH), one of the largest auto dealership groups with locations in major markets in the West, Southwest, and Southeast.
We first purchased SAH for the Strategy in 2014. But we exited the position two years later due to extraordinary costs Sonic was incurring to launch a used car business. Still, we continued to monitor their progress for the subsequent 9 years and repurchased shares earlier this year.
Sonic’s EchoPark used-car operation has reached profitability and has grown into a nationwide retailer specializing in stress-free, haggle-less sales. By streamlining inventory and focusing on 1-4 year-old autos, SAH can often price its vehicles $3,000 below competitors. Customers seem to like this approach, as Echo continues to grow nationwide.
We believe SAH’s used-car strategy is ideally suited for the current economic climate, where higher gas prices and interest rates are putting pressure on consumers. According to our research, earnings per share for Sonic should reach $8 in 2027, compared with an estimated $7 this year.
Our confidence is further buoyed by the fact that management has used free cash flow for an active, consistent buyback program. To put it in perspective, a decade ago SAH had 44.73 million shares outstanding, versus only 31.67 million today. The combination of an intriguing business model, solid earnings potential, and strong insider buying boosted our conviction. We reinitiated our position, paying a compelling single digit price-to-earnings multiple for a unique, growing, $15 billion industry leader.
The second quarter proved how strong the herd can be— and why it pays to go against the crowd. Recent volatility has created opportunities for value-minded investors who are willing to look beyond the AI trade. The fact that we’ve been able to add to existing positions in more than two dozen holdings across several sectors demonstrates how large parts of the market are being overlooked.
At the same time, changing views on AI winners and losers should give active value managers the chance to find real bargains among companies that have been overly or unfairly punished on disruption concerns. However, finding those companies takes extensive research and the discipline to stick to our knitting. For over four decades, we have used our 10 Principles of Value Investing™ as a consistent process by which we assess the changing risk/reward characteristics of a company and to guide us to these hidden gems.
Fundamentally yours,
The Heartland Investment Team
Scroll over to view complete data
| Since Inception (%) | 20-Year (%) | 15-Year (%) | 10-Year (%) | 5-Year (%) | 3-Year (%) | 1-Year (%) | YTD* (%) | QTD* (%) | |
|---|---|---|---|---|---|---|---|---|---|
| Value Investor Class | 11.53 | 7.58 | 10.57 | 10.52 | 12.07 | 20.55 | 19.95 | 16.90 | -6.96 |
| Value Institutional Class | 11.61 | 7.75 | 10.74 | 10.68 | 12.23 | 20.73 | 20.14 | 17.05 | -6.92 |
| Russell 2000® Value | 10.72 | 7.58 | 11.38 | 9.40 | 7.80 | 17.93 | 20.77 | 16.96 | -4.91 |
*Not annualized
Source: FactSet Research Systems Inc., Russell®, and Heartland Advisors, Inc.
The inception date for the Value Fund is 12/28/1984 for the investor class and 5/1/2008 for the institutional class.
In the prospectus dated 5/1/2026, the Gross Fund Operating Expenses for the investor and institutional classes of the Value Fund are 1.09% and 0.94%, respectively.
Past performance does not guarantee future results. Performance represents past performance; current returns may be lower or higher. Performance for institutional class shares prior to their initial offering is based on the performance of investor class shares. The investment return and principal value will fluctuate so that an investor's shares, when redeemed, may be worth more or less than the original cost. All returns reflect reinvested dividends and capital gains distributions, but do not reflect the deduction of taxes that an investor would pay on distributions or redemptions. Subject to certain exceptions, shares of a Fund redeemed or exchanged within 10 days of purchase are subject to a 2% redemption fee. Performance does not reflect this fee, which if deducted would reduce an individual's return. To obtain performance through the most recent month end, call 800-432-7856 or visit heartlandadvisors.com.


©2026 Heartland Advisors | 790 N. Water Street, Suite 1200, Milwaukee, WI 53202 | Business Office: 414-347-7777 | Financial Professionals: 888-505-5180 | Individual Investors: 800-432-7856
In the prospectus dated 5/1/2026, the Gross Fund Operating Expenses for the investor and institutional classes of the Value Fund are 1.09% and 0.94%, respectively.
Past performance does not guarantee future results. Performance represents past performance; current returns may be lower or higher. Performance for institutional class shares prior to their initial offering is based on the performance of investor class shares. The investment return and principal value will fluctuate so that an investor's shares, when redeemed, may be worth more or less than the original cost. All returns reflect reinvested dividends and capital gains distributions, but do not reflect the deduction of taxes that an investor would pay on distributions or redemptions. Subject to certain exceptions, shares of a Fund redeemed or exchanged within 10 days of purchase are subject to a 2% redemption fee. Performance does not reflect this fee, which if deducted would reduce an individual's return. To obtain performance through the most recent month end, call 800-432-7856 or visit heartlandadvisors.com.
An investor should consider the Funds’ investment objectives, risks, and charges and expenses carefully before investing or sending money. This and other important information may be found in the Funds' prospectus. To obtain a prospectus, please call 800-432-7856 or visit heartlandadvisors.com. Please read the prospectus carefully before investing.
As of 6/30/2026, i3 Verticals (IIIV), Photronics (PLAB), Sonic Automotive, Inc. (Class A) (SAH), and Unitil Corporation (UTL) represented 1.55%, 0.83%, 0.62%, and 1.05% of the Value Fund’s net assets, respectively.
Statements regarding securities are not recommendations to buy or sell.
Portfolio holdings are subject to change. Current and future portfolio holdings are subject to risk.
The Value Fund invests primarily in small companies selected on a value basis. Such securities generally are more volatile and less liquid than those of larger companies.
Value investments are subject to the risk that their intrinsic value may not be recognized by the broad market.
The Value Fund seeks long-term capital appreciation through investing in small companies.
The Fund’s performance information included in regulatory filings includes a required index that represents an overall securities market (Regulatory Benchmark). In addition, the Fund's regulatory filings may also include an index that more closely aligns to the Fund's investment strategy (Strategy Benchmark(s)). The Fund's performance included in marketing and advertising materials and information other than regulatory filings is generally compared only to the Strategy Benchmark.
The above individuals are registered representatives of ALPS Distributors, Inc.
The Heartland Funds are distributed by ALPS Distributors, Inc.
The statements and opinions expressed in this article are those of the presenter(s). Any discussion of investments and investment strategies represents the presenters’ views as of the date created and are subject to change without notice. The opinions expressed are for general information only and are not intended to provide specific advice or recommendations for any individual. The specific securities discussed, which are intended to illustrate the advisor’s investment style, do not represent all of the securities purchased, sold, or recommended by the advisor for client accounts, and the reader should not assume that an investment in these securities was or would be profitable in the future. Certain security valuations and forward estimates are based on Heartland Advisors’ calculations. Any forecasts may not prove to be true.
Economic predictions are based on estimates and are subject to change.
There is no guarantee that a particular investment strategy will be successful.
Sector and Industry classifications are sourced from GICS®.The Global Industry Classification Standard (GICS®) is the exclusive intellectual property of MSCI Inc. (MSCI) and S&P Global Market Intelligence (“S&P”). Neither MSCI, S&P, their affiliates, nor any of their third party providers (“GICS Parties”) makes any representations or warranties, express or implied, with respect to GICS or the results to be obtained by the use thereof, and expressly disclaim all warranties, including warranties of accuracy, completeness, merchantability and fitness for a particular purpose. The GICS Parties shall not have any liability for any direct, indirect, special, punitive, consequential or any other damages (including lost profits) even if notified of such damages.
Heartland Advisors defines market cap ranges by the following indices: micro-cap by the Russell Microcap®, small-cap by the Russell 2000®, mid-cap by the Russell Midcap®, large-cap by the Russell Top 200®.
Because of ongoing market volatility, performance may be subject to substantial short-term changes.
Dividends are not guaranteed and a company’s future ability to pay dividends may be limited. A company currently paying dividends may cease paying dividends at any time.
There is no assurance that dividend-paying stocks will mitigate volatility.
Russell Investment Group is the source and owner of the trademarks, service marks and copyrights related to the Russell Indices. Russell® is a trademark of the Frank Russell Investment Group.
Data sourced from FactSet: Copyright 2026 FactSet Research Systems Inc., FactSet Fundamentals. All rights reserved.
Artificial intelligence (AI) is intelligence—perceiving, synthesizing, and inferring information—demonstrated by computers, as opposed to intelligence displayed by humans or by other animals. Earnings Per Share is the portion of a company’s profit allocated to each outstanding share of common stock. Free Cash Flow is the amount of cash a company has after expenses, debt service, capital expenditures, and dividends. The higher the free cash flow, the stronger the company’s balance sheet. NASDAQ is a global electronic marketplace for buying and selling securities, as well as the benchmark index for U.S. technology stocks. NASDAQ was created by the National Association of Securities Dealers (NASD) to enable investors to trade securities on a computerized, speedy and transparent system, and commenced operations on February 8, 1971. Net Margin is the ratio of net profits to revenues for a company or business segment - typically expressed as a percentage – that shows how much of each dollar earned by the company is translated into profits. Price/Earnings Ratio of a stock is calculated by dividing the current price of the stock by its trailing or its forward 12 months’ earnings per share. Russell Investment Group is the source and owner of the trademarks, service marks and copyrights related to the Russell Indices. Russell® is a trademark of the Russell Investment Group. Russell 2000® Index includes the 2000 firms from the Russell 3000® Index with the smallest market capitalizations. All indices are unmanaged. It is not possible to invest directly in an index. Russell 2000® Value Index measures the performance of those Russell 2000® companies with lower price/book ratios and lower forecasted growth characteristics. Volatility is a statistical measure of the dispersion of returns for a given security or market index which can either be measured by using the standard deviation or variance between returns from that same security or market index. Commonly, the higher the volatility, the riskier the security. 10 Principles of Value Investing™ consist of the following criteria for selecting securities: (1) catalyst for recognition; (2) low price in relation to earnings; (3) low price in relation to cash flow; (4) low price in relation to book value; (5) financial soundness; (6) positive earnings dynamics; (7) sound business strategy; (8) capable management and insider ownership; (9) value of company; and (10) positive technical analysis.
Heartland’s investing glossary provides definitions for several terms used on this page.