Heartland Advisors

Heartland Small Cap Value Strategy 3Q23 Portfolio Manager Commentary

 Executive Summary

  • In a challenging environment, the Small Cap Value Strategy outperformed its benchmark, the Russell 2000® Value Index. Year to date, the Strategy is up 2.40%, while its benchmark is down 0.53%. 
  • Due to higher interest rates and inflation, investors are beginning to question the consensus view of an economic ‘soft landing’.
  • The ongoing underperformance of small caps suggests more volatility with opportunities on the horizon.

“Value investing requires deep reservoirs of patience and discipline."

​​​​​​—Seth Klarman

It’s been an especially challenging year for small-cap value investors. 

Last quarter, we discussed risk-taking returning to the marketplace, led by a frenzy in artificial intelligence and mega-cap technology stocks. As the Federal Reserve continued to raise interest rates, offering over 5.5% on short-term Treasuries, it was difficult to comprehend the lofty multiples being paid for a very narrow group of “growth on the come” businesses. To some extent, the air has been let out of this last balloon. But in our view, more is in store for overvalued, over-owned growth and momentum favorites.

Our portfolio experienced a modest level of activity during the period, adding only three new positions. It’s not that we aren’t actively looking for opportunities—we are. But as the legendary hedge fund manager Seth Klarman pointed out, value investing “requires deep reservoirs of patience and discipline.” 

As contrarians, we look for prospects not in what the herd is buying but what it’s selling or ignoring. Going against the crowd can be difficult because it requires a willingness to be “initially wrong” for extended stretches, Klarman noted, until rational thinking returns to the market. It also demands fortitude to wait until investments trade at prices that are truly attractive relative to their intrinsic value. That’s how we have always invested—and what we’re especially focused on today. 

To be sure, we are underexposed to higher-beta, early-cycle stocks. This is not a top-down call. Rather, it’s a reflection of the fact that many names on our watchlist aren’t at or near potential entry points. We’re willing to take pitches—as many as we have to—until hanging curve balls start coming over the plate. We will only swing when companies with attractive risk/reward characteristics fit our 10 Principles of Value Investing™.

We wouldn’t be surprised to start spotting more of those opportunities soon. Part of that is seen in how poorly small caps have been doing, compared to the largest stocks, as measured by the S&P 100 Index (see chart below). The relative outperformance of large caps, led by the so-called Magnificent 7, is disconcerting and suggests more volatility to come as the long lags of Federal Reserve interest rate hikes gradually work their way into the broader economy and markets. 

Historically, excessive gains by a narrow group of companies—in this case, the mega caps—has led to a significant correction in the opposite direction. To us, this disparity will be corrected and is a sign to remain patient and disciplined in the months and quarters ahead.

S&P 100 vs. Russell 2000®

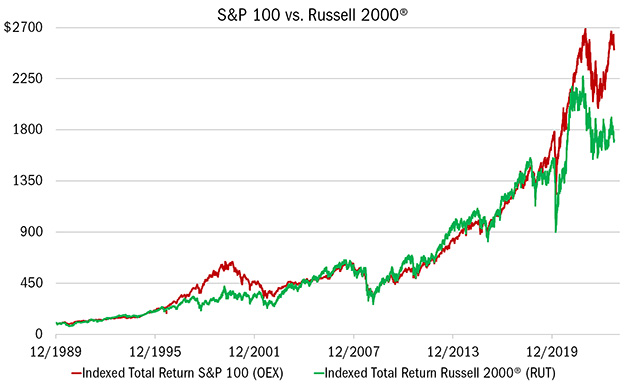
Source: FactSet; FTSE Russell, Daily data 12/29/1989 to 9/29/2023. The data in this chart represents a $100 investment in the S&P 100 (OEX) compared to the Russell 2000® (RUT) on a total return basis, which tracks both the capital gains as well as cash distributions (such as dividends, interest, and other realized distributions) attributed to the respective Index. Past performance does not guarantee future results. There is no guarantee that a particular investment strategy will be successful.

The markets are presently operating under two related assumptions. First, there’s the notion that the Federal Reserve has largely won the war against inflation after raising rates 11 times since March 2022. Given the unprecedented flood of stimulus during and after the pandemic, we’re not convinced this is true—at least not yet. Second, as banks continue to tighten lending standards while consumer loan delinquencies are climbing, the “soft landing” that many investors now expect is up for debate.

As those economic expectations are tested in the coming months, we wouldn’t be surprised to see more handwringing in the markets, along with opportunities.  

Attribution Analysis & Portfolio Activity

For the quarter, the Heartland Small Cap Value Strategy outperformed the Russell 2000® Value Index, with a return of -2.39% versus -2.96% for the benchmark. In a difficult market, the Small Cap Value Strategy generated gains in Energy (+25.57%), Consumer Staples (+10.64%) and Information Technology (+4.26%), owing largely to stock selection.

Throughout the year, we’ve done a decent job of taking what the market gives us, both on the upside (selling or paring down positions as they’ve hit target prices) and downside (buying beaten-down names once they fall to the right price). 

Below are examples of that selectivity:

Consumer Discretionary. Mohawk (MHK), the leading manufacturer of flooring products such as carpet, tile, wood, and vinyl products for the residential and commercial markets, ran into stiff headwinds in recent years as inflation increased costs on source materials. This compressed MHK’s margins, and the stock price was nearly cut in half between June 2021 and early this year. We believe the worst of those pricing pressures are behind the business, which stands to benefit from the ongoing growth in home remodeling and office space conversions as the commercial real estate market struggles with hybrid work. 

After initiating a position in Mohawk this Spring, we added to it during the quarter as the market sold off. While it’s not ideal that MHK continued to fall, the slide has allowed us to build an over 2% allocation in a name our research indicates is a long-term alpha generator at a compelling valuation.

Mohawk is priced at half of sales, less than tangible book value, and 9X our estimate of ‘23 earnings. With ample free cash flow and active share buybacks, we believe MHK possesses favorable risk-reward characteristics.

Utilities. National Fuel Gas (NFG) is another existing holding we added to in the quarter. NFG is an energy company, with regulated utility assets, involved in the production, transportation, and distribution of natural gas. The stock’s correlation with natural gas prices has been high, so it wasn’t too surprising when the stock fell as natural gas prices declined following last year’s benign winter. 

But prices are expected to rebound in the coming months now that the supply issue has been addressed with the steep drop in oil gas rig counts. Demand is also set to improve starting in 2025 with the onset of more U.S. liquefied natural gas (LNG) exports. Meanwhile, this is a well-run business with a track record of financial soundness. NFG, for instance, has raised dividends for 53 consecutive years because of the consistent cash flow generation from its midstream and utility segments. 

Yet, when looking at valuations, we see a disconnect. NFG is trading at a 20% discount to its historical valuations compared with traditional oil and gas exploration and production stocks. The relative premium it typically garners is a function of the company’s ability to leverage its pipeline infrastructure to capitalize on higher natural gas prices and the stability of non-energy cash flows. We are positioning the portfolio to take advantage of this opportunity.

Financials. With a 10% market share, Stewart Information Services (STC) is the smallest of the four companies enjoying an oligopoly in the title insurance industry. 

While most people don’t think about title insurance when purchasing a home, policies indemnify homeowners and lenders against title defects that could result in significant loss arising from back taxes, liens, and other claims. Ever since a proposed sale to larger peer Fidelity National Financial was blocked by the Federal Trade Commission in 2019, STC has been in need of a new direction. Since being named CEO that same year, Fred Eppinger has set out to improve the company’s margin structure and take market share. 

These operational improvements, however, have been hidden by lower top-line volume as rising mortgage rates have curtailed home transactions. As a result, STC shares fell to nearly 90% of book value, well below its 10-year average of 1.3X. 

As housing sales normalize over time and revenues recover, we view STC’s earnings to have significant upside and the stock should trade closer to its historic average. Moreover, the realization of its improved margin structure could result in a multiple that’s closer to peers First American Financial and Fidelity National Financial, which have historically traded at a premium to STC.

Outlook

While waiting for those hanging curve balls, we are sticking to our process. Guided by the 10 Principles of Value Investing™, we are laser-focused on identifying well-managed, financially strong companies with resilient balance sheets that offer compelling valuations. We feel good about the opportunities ahead but are content to keep our powder dry if entry points don’t materialize. As Seth Klarman advised, value investing requires deep reservoirs of patience and discipline.

Fundamentally Yours, The Heartland Team

Please wait while we gather your results.

Portfolio Management Team

Heartland Advisors Value Investing Portfolio Manager Will Nasgovitz

Will Nasgovitz

CEO and Portfolio Manager

Heartland Advisors Value Investing Portfolio Manager Bill Nasgovitz

Bill Nasgovitz

Chairman and Portfolio Manager

Composite Returns*

Scroll over to view complete data

Source: FactSet Research Systems Inc., Russell Investment Group, and Heartland Advisors, Inc.
*Yearly and quarterly returns are not annualized. The Strategy's inception date is 10/1/1988. 
**Shown as supplemental information. 

The US Dollar is the currency used to express performance. Returns are presented net of advisory fees and net of bundled fees and include the reinvestment of all income. The returns net of bundled fees were calculated by subtracting the highest applicable sponsor portion of the separately managed wrap account fee from the net of advisor fees return.

Small Cap Value Strategy Quick Links

Factsheet


Download PDF

Commentary


View Commentary

Attribution & Contribution Reports

Sign In

Holdings


Sign In


Email Sign Up


©2024 Heartland Advisors | 790 N. Water Street, Suite 1200, Milwaukee, WI 53202 | Business Office: 414-347-7777 | Financial Professionals: 888-505-5180 | Individual Investors: 800-432-7856

Past performance does not guarantee future results.

The Small Cap Value Strategy seeks long-term capital appreciation by investing in micro- and small-cap companies, generally with market capitalizations of less than the largest companies in the Russell 2000 Value Index, at the time of purchase. The micro- and small-cap segment of the stock market is robust with thousands of publicly traded issues, many of which lack traditional Wall Street research coverage. Thus, we believe this market is often inefficient, mispricing businesses and offering opportunities for fundamental research-minded investors such as Heartland.

The Small Cap Value Strategy invests in small companies selected on a value basis. Such securities generally are more volatile and less liquid than those of larger companies.

Value investments are subject to the risk that their intrinsic value may not be recognized by the broad market.

Heartland Advisors, Inc. (the "Firm") claims compliance with the Global Investment Performance Standards (GIPS®). The Firm is a wholly owned subsidiary of Heartland Holdings, Inc., and is registered with the Securities and Exchange Commission. For a complete list and description of Heartland Advisors composites and/or a presentation that adheres to the GIPS® standards, contact the Institutional Sales Team at Heartland Advisors, Inc. at the address listed below.

As of 9/30/2023, Mohawk (MHK), National Fuel Gas (NFG), and Stewart Information Services (STC), represented 2.79%, 3.41%, and 1.06% of the Small Cap Value Composite’s net assets, respectively. Fidelity National Financial Inc. (FNF) and First American Financial Corporation (FAF), are unowned by the Small Cap Value Composite.

The future performance of any specific investment or strategy (including the investments discussed above) should not be assumed to be profitable or equal to past results. The performance of the holdings discussed above may have been the result of unique market circumstances that are no longer relevant. The holdings identified above do not represent all of the securities purchased, sold or recommended for the Advisor’s clients.

Portfolio holdings are subject to change. Current and future portfolio holdings are subject to risk.

In certain cases, dividends and earnings are reinvested.

GIPS® is a registered trademark of CFA Institute. CFA Institute does not endorse or promote this organization, nor does it warrant the accuracy or quality of the content contained herein.

Separately managed accounts and related investment advisory services are provided by Heartland Advisors, Inc., a federally registered investment advisor. ALPS Distributors, Inc., is not affiliated with Heartland Advisors, Inc.

The statements and opinions expressed in this article are those of the presenter(s). Any discussion of investments and investment strategies represents the presenters’ views as of the date created and are subject to change without notice. The opinions expressed are for general information only and are not intended to provide specific advice or recommendations for any individual. The specific securities discussed, which are intended to illustrate the advisor’s investment style, do not represent all of the securities purchased, sold, or recommended by the advisor for client accounts, and the reader should not assume that an investment in these securities was or would be profitable in the future. Certain security valuations and forward estimates are based on Heartland Advisors’ calculations. Any forecasts may not prove to be true. 

Economic predictions are based on estimates and are subject to change.

There is no guarantee that a particular investment strategy will be successful.

Sector and Industry classifications are sourced from GICS®.The Global Industry Classification Standard (GICS®) is the exclusive intellectual property of MSCI Inc. (MSCI) and S&P Global Market Intelligence (“S&P”).  Neither MSCI, S&P, their affiliates, nor any of their third party providers (“GICS Parties”) makes any representations or warranties, express or implied, with respect to GICS or the results to be obtained by the use thereof, and expressly disclaim all warranties, including warranties of accuracy, completeness, merchantability and fitness for a particular purpose.  The GICS Parties shall not have any liability for any direct, indirect, special, punitive, consequential or any other damages (including lost profits) even if notified of such damages.

Heartland Advisors defines market cap ranges by the following indices: micro-cap by the Russell Microcap®, small-cap by the Russell 2000®, mid-cap by the Russell Midcap®, large-cap by the Russell Top 200®.

Because of ongoing market volatility, performance may be subject to substantial short-term changes.

Dividends are not guaranteed and a company’s future ability to pay dividends may be limited. A company currently paying dividends may cease paying dividends at any time.

There is no assurance that dividend-paying stocks will mitigate volatility.

Russell Investment Group is the source and owner of the trademarks, service marks and copyrights related to the Russell Indices. Russell® is a trademark of the Frank Russell Investment Group.

Data sourced from FactSet: Copyright 2024 FactSet Research Systems Inc., FactSet Fundamentals. All rights reserved.

Heartland’s investing glossary provides definitions for several terms used on this page.

Alpha is a risk-adjusted measure of a portfolio's annual return in excess of the market return. It is a measure of a portfolio manager's contribution to performance due to security selection. A positive alpha indicates the portfolio outperformed the market on a risk-adjusted basis, and a negative alpha indicates the portfolio performed worse than the market. Artificial intelligence (AI) is intelligence—perceiving, synthesizing, and inferring information—demonstrated by computers, as opposed to intelligence displayed by humans or by other animals. Beta is a measure of the sensitivity of a portfolio's rates of return against those of the market. A beta less than 1 indicates volatility less than that of the market. Book Value is the sum of all of a company’s assets, minus its liabilities. Buyback is the repurchase of outstanding shares (repurchase) by a company in order to reduce the number of shares on the market. Dividend Growth Rate is the annualized percentage of growth of a stock’s dividend during a specified period of time. Free Cash Flow is the amount of cash a company has after expenses, debt service, capital expenditures, and dividends. The higher the free cash flow, the stronger the company’s balance sheet. Federal Funds Rate is the interest rate at which a depository institution lends funds maintained at the Federal Reserve to another depository institution overnight. Inflation Risk is the possibility that the value of assets or income will decrease as inflation shrinks the purchasing power of a currency. Intrinsic Value is the actual value of a company or an asset based on an underlying perception of its true value including all aspects of the business, in terms of both tangible and intangible factors. This value may or may not be the same as the current market value. Leverage is the amount of debt used to finance a firm's assets. A firm with significantly more debt than equity is considered to be highly leveraged. Margin of Safety is a principle of investing in which an investor only purchases securities when the market price is significantly below its intrinsic value. Risk on/Risk off Theory is an investment setting in which price behavior responds to, and is driven by, changes in investor risk tolerance. Risk-on risk-off refers to changes in investment activity in response to global economic patterns. During periods when risk is perceived as low, risk-on risk-off theory states that investors tend to engage in higher-risk investments. When risk is perceived as high, investors have the tendency to gravitate toward lower-risk investments. Russell Investment Group is the source and owner of the trademarks, service marks and copyrights related to the Russell Indices. Russell® is a trademark of the Russell Investment Group. Russell 2000® Value Index measures the performance of those Russell 2000® companies with lower price/book ratios and lower forecasted growth characteristics. All indices are unmanaged. It is not possible to invest directly in an index. S&P 100 Index measures the performance of large cap companies in the U.S. The Index comprises 100 major, blue chip companies across multiple industry groups. All indices are unmanaged. It is not possible to invest directly in an index. Tangible Book Value is the sum of all of a company’s assets, minus its liabilities and intangible assets, such as goodwill. Treasury Bill (T-Bill) is a short-term debt obligation backed by the U.S. government with a maturity of less than one year. T-bills are sold in denominations of $1,000 up to a maximum purchase of $5 million and commonly have maturities of one month (four weeks), three months (13 weeks) or six months (26 weeks). Volatility is a statistical measure of the dispersion of returns for a given security or market index which can either be measured by using the standard deviation or variance between returns from that same security or market index. Commonly, the higher the volatility, the riskier the security. 10 Principles of Value Investing™ consist of the following criteria for selecting securities: (1) catalyst for recognition; (2) low price in relation to earnings; (3) low price in relation to cash flow; (4) low price in relation to book value; (5) financial soundness; (6) positive earnings dynamics; (7) sound business strategy; (8) capable management and insider ownership; (9) value of company; and (10) positive technical analysis.

top