Pursues long-term capital appreciation by investing in a concentrated number of micro- and small-cap companies
The Heartland Small Cap Value Strategy seeks long-term capital appreciation by investing in a concentrated number of undervalued micro- and small-cap stocks. The Strategy utilizes Heartland’s 10 Principles of Value Investing™ for stock analysis along with a collection of rules and tools designed to construct the overall portfolio such that stock selection is the primary driver of relative performance. This approach helps navigate the asset class and may increase the likelihood of potential outperformance relative to the Russell 2000® Value Index.

Minimum: $1 million
| Account Size | Annual Rate (%) |
|---|---|
| First $5 million | 1.00 |
| Next $10 million | 0.85 |
| Above $15 million | Negotiable |
6/30/2026
Scroll over to view complete data
| Since Inception (%) | 10-Year (%) | 5-Year (%) | 3-Year (%) | 1-Year (%) | YTD (%) | QTD (%) | |
|---|---|---|---|---|---|---|---|
| Small Cap Value Composite (Net of Advisory Fees)** | 11.75 | 12.59 | 15.05 | 26.32 | 40.23 | 21.30 | 13.69 |
| Small Cap Value Composite (Net of Bundled Fees) | 10.33 | 12.27 | 14.74 | 26.02 | 39.96 | 21.19 | 13.63 |
| Russell 2000® Value | 10.48 | 10.89 | 8.23 | 18.73 | 43.01 | 22.99 | 17.19 |
|
|
2025 (%) |
2024 (%) |
2023 (%) |
2022 (%) |
2021 (%) |
2020 (%) |
2019 (%) |
2018 (%) |
2017 (%) |
2016 (%) |
2015 (%) |
2014 (%) |
2013 (%) |
2012 (%) |
2011 (%) |
2010 (%) |
2009 (%) |
2008 (%) |
2007 (%) |
2006 (%) |
2005 (%) |
|---|---|---|---|---|---|---|---|---|---|---|---|---|---|---|---|---|---|---|---|---|---|
|
Small Cap Value Composite (Net of Advisory Fees)** |
28.44 | 23.29 | 10.31 | -11.13 | 18.85 | 20.09 | 24.46 | -14.74 | -2.20 | 11.51 |
-13.41 |
-2.96 |
19.72 |
6.51 |
-4.32 |
23.54 |
73.03 |
-44.18 |
-10.54 |
20.09 |
1.99 |
|
Small Cap Value Composite (Net of Bundled Fees) |
28.12 | 22.93 | 9.99 | -11.40 | 18.50 | 19.74 | 24.10 | -15.01 | -2.49 | 11.19 | -14.27 |
-3.92 |
18.54 |
5.45 |
-5.27 |
22.37 |
71.35 |
-44.75 |
-11.78 |
17.77 |
-0.01 |
|
Russell 2000® Value |
12.59 | 8.05 | 14.65 | -14.48 | 28.27 | 4.63 | 22.39 | -12.86 | 7.84 | 31.74 | -7.47 |
4.22 |
34.52 |
18.05 |
-5.50 |
24.50 |
20.58 |
-28.92 |
-9.78 |
23.48 |
4.71 |
*Source: FactSet Research Systems, Inc., Russell Investment Group, and Heartland Advisors, Inc.
YTD and QTD returns are not annualized. The Strategy's inception date is 10/1/1988.
**Shown as supplemental information.
6/30/2026
Scroll over to view complete data
| Weighted Average Market Cap ($) | Median Market Cap ($) | Trailing 1-Year Turnover (%) | |
|---|---|---|---|
| Small Cap Value Composite | 2.7 billion | 1.6 billion | 89.1 |
| Russell 2000® Value | 3.5 billion | 937 million | - |
Source: FactSet Research Systems Inc., Russell Investment Group, and Heartland Advisors, Inc.
3/31/2026
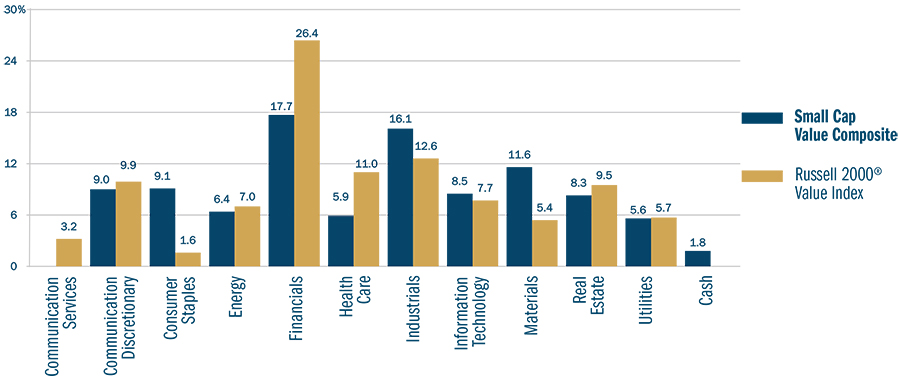
Source: FactSet Research Systems Inc., and Russell Investment Group
Composite statistics shown as percentage of equity investmentsty investments
6/30/2026
Scroll over to view complete data
| Ticker | Holding | % of Account | Industry |
|---|---|---|---|
| ECPG | Encore Capital Group, Inc. | 5.2 | Consumer Finance |
| LYFT | Lyft, Inc. Class A | 4.1 | Ground Transportation |
| TTI | TETRA Technologies, Inc. | 3.7 | Energy Equipment & Services |
| ASO | Academy Sports and Outdoors, Inc. | 3.7 | Specialty Retail |
| CGAU | Centerra Gold, Inc | 3.6 | Metals & Mining |
| XRAY | DENTSPLY SIRONA, Inc. | 3.6 | Health Care Equipment & Supplies |
| INBK | First Internet Bancorp | 3.5 | Banks |
| EGO | Eldorado Gold Corp. | 3.4 | Metals & Mining |
| PRMB | Primo Brands Corp (Class A) | 3.3 | Beverages |
| CCS | Century Communities, Inc. | 3.1 | Household Durables |
| % of Total Net Assets | 37.2 | ||
6/30/2026
Scroll over to view complete data
| Alpha* | Standard Deviation (%)* | Beta | Info Ratio | Sharpe Ratio | Upside Capture (%)* | Downside Capture (%)* | R- Squared (%) | Active Share | |
|---|---|---|---|---|---|---|---|---|---|
| Small Cap Value Composite (Net of Advisory Fees) | 7.61 | 19.02 | 0.86 | 0.83 | 0.60 | 101.28 | 79.74 | 83.48 | 98.1 |
| Russell 2000® Value | 0.00 | 20.29 | 1.00 | -- | 0.22 | 100.00 | 100.00 | 100.00 | 0 |
*Annualized
Source: FactSet Research Systems Inc., Russell Investment Group
Alpha, beta, and information ratio are versus the Russell 2000® Value Index.
Certain performance, portfolio composition, and/or risk analysis data may be preliminary.
100 years of industry experience
77 years of experience at Heartland
©2026 Heartland Advisors | 790 N. Water Street, Suite 1200, Milwaukee, WI 53202 | Business Office: 414-347-7777 | Financial Professionals: 888-505-5180 | Individual Investors: 800-432-7856
Past performance does not guarantee future results. Performance represents past performance, and current returns may differ.
Heartland Advisors, Inc. (the "Firm") claims compliance with the Global Investment Performance Standards (GIPS®). The Firm is a wholly owned subsidiary of Heartland Holdings, Inc., and is registered with the Securities and Exchange Commission. For a complete list and description of Heartland Advisors composites and/or a presentation that adheres to the GIPS® standards, contact the Institutional Sales Team at Heartland Advisors, Inc. at the address listed below.
The U.S. dollar is the currency used to express performance.
The inception date for the Small Cap Value Strategy is 10/1/1988.
The Small Cap Value Strategy invests in small and micro companies selected on a value basis. Such securities generally are more volatile and less liquid than those of larger companies.
Value investments are subject to the risk that their intrinsic value may not be recognized by the broad market.
Portfolio holdings are subject to change. Current and future portfolio holdings are subject to risk.
Sector and Industry classifications are sourced from GICS®.The Global Industry Classification Standard (GICS®) is the exclusive intellectual property of MSCI Inc. (MSCI) and S&P Global Market Intelligence (“S&P”). Neither MSCI, S&P, their affiliates, nor any of their third party providers (“GICS Parties”) makes any representations or warranties, express or implied, with respect to GICS or the results to be obtained by the use thereof, and expressly disclaim all warranties, including warranties of accuracy, completeness, merchantability and fitness for a particular purpose. The GICS Parties shall not have any liability for any direct, indirect, special, punitive, consequential or any other damages (including lost profits) even if notified of such damages.
Representative account chosen based on composite membership, not on performance-based criteria. Other accounts within the strategy may have different holdings.
Representative account holdings are preliminary, may not be reconciled, and may be updated when reconciled.
Certain security valuations and forward estimates are based on Heartland Advisors' calculations. Certain outliers may be excluded. Any forecasts may not prove to be true.
There is no guarantee that a particular investment strategy will be successful.
Heartland’s investing glossary provides definitions for several terms used on this page.
CFA® is a registered trademark owned by the CFA Institute.
Separately managed accounts and related investment advisory services are provided by Heartland Advisors, Inc., a federally registered investment advisor. ALPS Distributors, Inc., is not affiliated with Heartland Advisors, Inc.


