Heartland Advisors

Heartland Value Fund 4Q23 Portfolio Manager Commentary

Executive Summary

  • It was a strong year for the Heartland Value Fund, which returned +17.1% in 2023, compared to +14.7% for the benchmark.
  • Small caps emerged out of the shadows of the Magnificent 7 late in the fourth quarter, led by a strong rally in the Russell 2000® Value Index.
  • With the average stock in our portfolio trading at just 12X 2024 earnings, we believe there is more opportunity ahead.

Past performance is no guarantee of future results and investment returns and principal value of the Fund will fluctuate so that shares, when redeemed, may be worth more or less than the original cost. Current performance may be higher or lower than the performance quoted. Call 800-432-7856 or visit heartlandadvisors.com for current month end performance.

“We are not excited about owning the S&P 500 at market weight. It is dominated today by seven stocks that are correlated with each other, and they are all super expensive as a starting point.”

​​​​​​—Lisa Shalett, CIO Morgan Stanley Wealth Management

As long-term fans of small caps, we couldn’t agree more with Lisa Shalett of Morgan Stanley Wealth Management. Heartland’s love and focus for more than 40 years has been researching small- and micro-caps in search of compelling valuations offering potential capital appreciation. 

As seen in the table below from institutional research firm The Leuthold Group, LLC, small caps are trading at a 21% discount to large caps. The Fund, with a median market cap of approximately $1.2 billion, is squarely focused on the market segment labeled Deciles 7-10, which, on a price-to-earnings basis, is the cheapest part of the U.S. market. This is only the third time since 1980 that our universe has been this severely on sale. 

S&P 100 vs. Russell 2000®

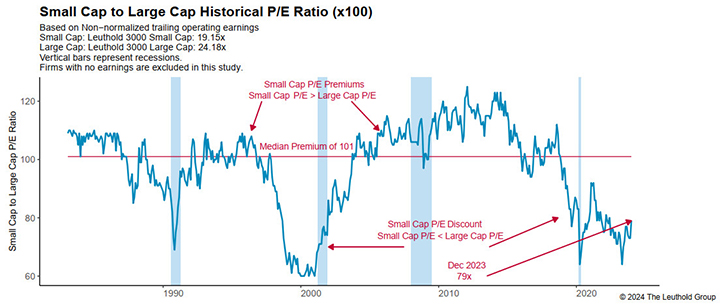
Source: The Leuthold Group. Monthly data from 1/31/1983 to 12/31/2023. This chart represents Small Cap to Large Cap Historical Price/Earnings Ratio multiplied by 100. All indices are unmanaged. It is not possible to invest directly in an index. Past performance does not guarantee future results.

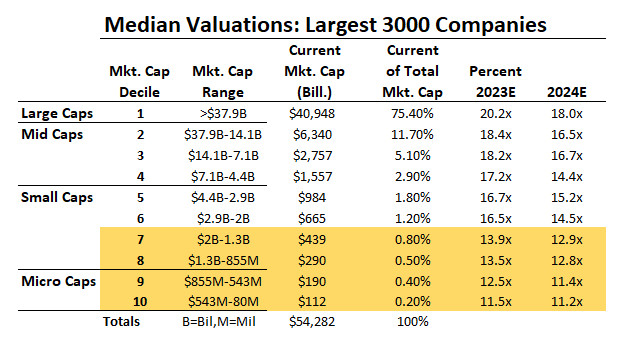
Source: The Leuthold Group. This table represents Median Valuations across the largest 3000 companies categorized within Large Caps, Mid Caps, Small Caps, and Micro Caps. All indices are unmanaged. It is not possible to invest directly in an index. Past performance does not guarantee future results.

As value investors, we are betting on mean reversion and this disparity closing. That process might have begun. Since Oct. 27, the Russell 2000® Value Index has surged 24.6%, outpacing the S&P 500 as well as the Magnificent 7, the mega-cap tech stocks that accounted for much of the broad market’s gains in 2023. 

What might be the catalyst to keep this going? Demand, for starters. Ms. Shalett, CIO of $6 trillion in assets, twice the size of the small-cap market, indicates she is fond of small value. Valuations, too, are supportive, with robust free cash flows and 10% earnings yields possible. In Federal Reserve Chairman Powell’s new world of lower interest rates, the Fund priced at only 12X forward earnings looks compelling. 

Attribution Analysis & Portfolio Activity

For the quarter, the Heartland Value Fund returned 11.7%, trailing the 15.3% gains for the Russell 2000® Value Index. Part of that is attributable to security selection in addition to the strong rally in early cycle sectors where we were underweight. 

For the full year, the Fund outperformed, up 17.1% versus 14.7% for the benchmark, driven primarily by stock selection. Throughout the year, we’ve done a decent job of taking what the market gives us and waiting for hanging curve balls to come over the plate.

A good example is UGI Corporation (UGI), an energy holding company that operates natural gas pipelines and regulated utilities in Pennsylvania and West Virginia while also distributing propane to residential and commercial customers through its AmeriGas and UGI International subsidiaries. 

The overhang on UGI’s stock, which was nearly cut in half from February to October, has been the deteriorating EBITDA contributions from AmeriGas. After rolling up this business over the years, the company decided in 2021 to integrate all the acquisitions from a systems, distribution, and call center perspective. Unfortunately, they dropped the ball on execution, as customer retention was poor due to elevated driver turnover and overall poor service levels. 

In late August, UGI announced a strategic review to evaluate all options for the business, which includes sticking with the turnaround plan which has showed two quarters of stabilization. CEO Roger Perreault, who led the initial transformation of AmeriGas, also announced he was stepping down. We think his departure is a positive for this undervalued energy company.

We initiated a position in this company in the fourth quarter as the stock was trading close to book value and just 7.5X earnings, for an earnings yield of 13.3%. By comparison, pipelines trade at over 16X forward earnings and utilities at 20X. Although UGI’s pipeline and propane businesses are more volatile than a traditional regulated utility, a dividend yield of over 6%, in our view, more than compensates. 

WideOpenWest (WOW), which is in the process of exiting the cable television business to focus on its high-margin, high-speed data internet (HSD) segment, was a disappointment.

The HSD industry has been under intense pressure lately as subscriber growth has normalized after a robust period during the pandemic, when work-at-home protocols sparked demand for quality, broadband internet service. Inflation is also driving price-sensitive consumers to evaluate lower-priced alternative options, such as 5G wireless broadband. This led us to lower our estimates of earnings and cash flows, which triggered exiting the position in the fourth quarter.

Early last year, we highlighted Centerra Gold (CGAU), a producer of gold and copper. With the recent pivot by the Federal Reserve to an easy money policy, we thought an update of this underappreciated hard asset was timely.

Centerra continues to make progress in increasing production while lowering costs. During the third quarter, the Oksut mine restarted, resulting in earnings per share of $0.20 while throwing off cash flow in excess of $100 million. Centerra remains debt free with cash soaring to $492 million, or $2.28 per share. A new management team is focused on optimizing a diverse portfolio of assets, including a strategy to boost the value of its molybdenum business for eventual sale. With an admirable balance sheet, Centerra has the resources to fund an aggressive exploration program in North America, pay a 3.3% dividend, and embark on an 8.5% repurchase of shares outstanding.

Trading below stated book value, approximately 60% of NAV, and less than 3X EV/EBITDA, we believe Centerra remains an outstanding small cap value.

Outlook

The rebound in small value late in the quarter is a ray of sunshine. The wide disparity in valuations relative to large caps provides confidence that a meaningful transition will eventually take place, whether today’s rally is it or not. In the meantime, we remain focused on investing basics, including fundamental research and price awareness. We set multiple price targets for every stock we own (or consider owning) to reflect both good and bad scenarios to prevent us from blindly chasing (or hanging onto) positions. This enables us to stay true to our 10 Principles of Value Investing™, which demand paying low prices relative to earnings, cash flow, and intrinsic value to help create a margin of safety.

Wishing you and yours a Healthy and Happy New Year, 
The Heartland Investment Team

Please wait while we gather your results.

Portfolio Management Team

Heartland Advisors Value Investing Portfolio Manager Will Nasgovitz

Will Nasgovitz

CEO and Portfolio Manager

Heartland Advisors Value Investing Portfolio Manager Bill Nasgovitz

Bill Nasgovitz

Chairman and Portfolio Manager

Fund Returns

Scroll over to view complete data

*Not annualized

Source: FactSet Research Systems Inc., Russell®, and Heartland Advisors, Inc.

The inception date for the Value Fund is 12/28/1984 for the investor class and 5/1/2008 for the institutional class.

Value Fund Quick Links

Factsheet


Download PDF

Commentary


View Commentary

Attribution & Contribution Reports

Sign In

Holdings


View Holdings


Email Sign Up


©2024 Heartland Advisors | 790 N. Water Street, Suite 1200, Milwaukee, WI 53202 | Business Office: 414-347-7777 | Financial Professionals: 888-505-5180 | Individual Investors: 800-432-7856

In the prospectus dated 5/1/2023, the Gross Fund Operating Expenses for the investor and institutional classes of the Value Fund are 1.09% and 0.98%, respectively.

Past performance does not guarantee future results. Performance represents past performance; current returns may be lower or higher. Performance for institutional class shares prior to their initial offering is based on the performance of investor class shares. The investment return and principal value will fluctuate so that an investor's shares, when redeemed, may be worth more or less than the original cost. All returns reflect reinvested dividends and capital gains distributions, but do not reflect the deduction of taxes that an investor would pay on distributions or redemptions. Subject to certain exceptions, shares of a Fund redeemed or exchanged within 10 days of purchase are subject to a 2% redemption fee. Performance does not reflect this fee, which if deducted would reduce an individual's return. To obtain performance through the most recent month end, call 800-432-7856 or visit heartlandadvisors.com.

An investor should consider the Funds’ investment objectives, risks, and charges and expenses carefully before investing or sending money. This and other important information may be found in the Funds' prospectus. To obtain a prospectus, please call 800-432-7856 or visit heartlandadvisors.com. Please read the prospectus carefully before investing.

As of 12/31/2023, Centerra Gold, Inc. (CGAU) and UGI Corporation (UGI) represented 1.52% and 1.04% of the Value Fund’s net assets, respectively. WideOpenWest, Inc. (WOW) is unowned by the Value Fund.

Statements regarding securities are not recommendations to buy or sell.

Portfolio holdings are subject to change. Current and future portfolio holdings are subject to risk.

The Value Fund primarily invests in small companies selected on a value basis. Such securities generally are more volatile and less liquid than those of larger companies.

Value investments are subject to the risk that their intrinsic value may not be recognized by the broad market.

The Value Fund seeks long-term capital appreciation through investing in small companies.

The above individuals are registered representatives of ALPS Distributors, Inc.

The Heartland Funds are distributed by ALPS Distributors, Inc.

The statements and opinions expressed in this article are those of the presenter(s). Any discussion of investments and investment strategies represents the presenters’ views as of the date created and are subject to change without notice. The opinions expressed are for general information only and are not intended to provide specific advice or recommendations for any individual. The specific securities discussed, which are intended to illustrate the advisor’s investment style, do not represent all of the securities purchased, sold, or recommended by the advisor for client accounts, and the reader should not assume that an investment in these securities was or would be profitable in the future. Certain security valuations and forward estimates are based on Heartland Advisors’ calculations. Any forecasts may not prove to be true. 

Economic predictions are based on estimates and are subject to change.

There is no guarantee that a particular investment strategy will be successful.

Sector and Industry classifications are sourced from GICS®.The Global Industry Classification Standard (GICS®) is the exclusive intellectual property of MSCI Inc. (MSCI) and S&P Global Market Intelligence (“S&P”).  Neither MSCI, S&P, their affiliates, nor any of their third party providers (“GICS Parties”) makes any representations or warranties, express or implied, with respect to GICS or the results to be obtained by the use thereof, and expressly disclaim all warranties, including warranties of accuracy, completeness, merchantability and fitness for a particular purpose.  The GICS Parties shall not have any liability for any direct, indirect, special, punitive, consequential or any other damages (including lost profits) even if notified of such damages.

Heartland Advisors defines market cap ranges by the following indices: micro-cap by the Russell Microcap®, small-cap by the Russell 2000®, mid-cap by the Russell Midcap®, large-cap by the Russell Top 200®.

Because of ongoing market volatility, performance may be subject to substantial short-term changes.

Dividends are not guaranteed and a company’s future ability to pay dividends may be limited. A company currently paying dividends may cease paying dividends at any time.

There is no assurance that dividend-paying stocks will mitigate volatility.

Russell Investment Group is the source and owner of the trademarks, service marks and copyrights related to the Russell Indices. Russell® is a trademark of the Frank Russell Investment Group.

Data sourced from FactSet: Copyright 2024 FactSet Research Systems Inc., FactSet Fundamentals. All rights reserved.

Book Value is the sum of all of a company’s assets, minus its liabilities. Dividend Yield is a ratio that shows how much a company pays out in dividends each year relative to its share price. Earnings Before Interest, Taxes, Depreciation and Amortization (EBITDA) measures a company’s financial performance. It is used to analyze and compare profitability between companies and industries because it eliminates the effects of financing and accounting decisions. Enterprise Value/Earnings Before Interest, Taxes, Depreciation, and Amortization (EV/EBITDA) Ratio is a financial indicator used to determine the value of a company and is calculated by dividing the entire economic value of the company (enterprise value) by its earnings before interest, taxes, depreciation, and amortization (EBITDA). Earnings Per Share is the portion of a company’s profit allocated to each outstanding share of common stock. Earnings Yield is the reciprocal of the price to earnings ratio. Free Cash Flow is the amount of cash a company has after expenses, debt service, capital expenditures, and dividends. The higher the free cash flow, the stronger the company’s balance sheet. Intrinsic Value is the actual value of a company or an asset based on an underlying perception of its true value including all aspects of the business, in terms of both tangible and intangible factors. This value may or may not be the same as the current market value. Margin of Safety is a principle of investing in which an investor only purchases securities when the market price is significantly below its intrinsic value. Mean Reversion is the theory that interest rates, security prices, or various economic indicators will, over time, return to their long-term averages after a significant short-term move. Net Asset Value (NAV) is a mutual fund's price per share that is calculated by dividing the total value of all the securities in its portfolio, less any liabilities, by the number of fund shares outstanding. Russell Investment Group is the source and owner of the trademarks, service marks and copyrights related to the Russell Indices. Russell® is a trademark of the Russell Investment Group. Russell 2000® Value Index measures the performance of those Russell 2000® companies with lower price/book ratios and lower forecasted growth characteristics. S&P 500 Index is an index of 500 U.S. stocks chosen for market size, liquidity and industry group representation and is a widely used U.S. equity benchmark. All indices are unmanaged. It is not possible to invest directly in an index. Volatility is a statistical measure of the dispersion of returns for a given security or market index which can either be measured by using the standard deviation or variance between returns from that same security or market index. Commonly, the higher the volatility, the riskier the security. 10 Principles of Value Investing™ consist of the following criteria for selecting securities: (1) catalyst for recognition; (2) low price in relation to earnings; (3) low price in relation to cash flow; (4) low price in relation to book value; (5) financial soundness; (6) positive earnings dynamics; (7) sound business strategy; (8) capable management and insider ownership; (9) value of company; and (10) positive technical analysis.

Heartland’s investing glossary provides definitions for several terms used on this page.

top