HRVIX, HNVIX
Invests in undervalued small companies and seeks to reduce volatility through strong balance sheets and dividends
The Heartland Value Plus Fund seeks long-term capital appreciation by investing in a high-conviction portfolio (40-70 holdings) of undervalued small cap stocks with strong balance sheets, the majority of which pay dividends. The Fund utilizes Heartland’s 10 Principles of Value Investing™ for stock analysis along with a collection of rules and tools designed to construct the overall portfolio such that stock selection is the primary driver of relative performance. The narrow focus on specific catalysts to unlock value adds discipline and consistency.

6/30/2026
Scroll over to view complete data
| Investor Class | Institutional Class | |
|---|---|---|
| Ticker | HRVIX | HNVIX |
| CUSIP | 422352500 | 422352849 |
| Inception Date | 10/26/1993 | 5/1/2008 |
| Assets | 186 million | 144 million |
| Investor Class ($) |
Institutional Class ($) |
|
|---|---|---|
| Initial Investment | 1,000 | 500,000 |
| IRA Initial Investment | 500 | 500,000 |
| Subsequent Investments | 100 | 100 |
Paid directly from total investment
|
Investor Class (%) |
Institutional Class (%) |
|
|---|---|---|
| Load | 0 | 0 |
| Sales Charge | 0 | 0 |
| Exchange Fee | 0 | 0 |
| Redemption Fee* | 2 | 2 |
*If shares are redeemed or exchanged within 10 days of purchase
Paid annually as a percentage of total investment value*
| Investor Class (%) |
Institutional Class (%) |
|
|---|---|---|
| Management Fee | 0.70 | 0.70 |
| 12b-1 Distribution Fee | 0.25 | 0.00 |
| Other Expenses | 0.27 | 0.29 |
| Total Annual Fund Operating Expenses | 1.22 | 0.99 |
*As stated in the prospectus dated 5/1/2026The Advisor has voluntarily agreed to waive fees and/or reimburse expenses with respect to the institutional class, to the extent necessary to maintain the institutional class’ “Net Annual Operating Expenses” at a ratio not to exceed 0.99% of average daily net assets. This voluntary waiver/reimbursement may be discontinued at any time. Without such waivers and/or reimbursements, total returns may have been lower.
Scroll over to view complete data
| Since Inception (%) | 20-Year (%) | 15-Year (%) | 10-Year (%) | 5-Year (%) | 3-Year (%) | 1-Year (%) | YTD* (%) | QTD* (%) | |
|---|---|---|---|---|---|---|---|---|---|
| Value Plus Investor Class | 9.60 | 8.02 | 7.15 | 9.98 | 4.12 | 8.59 | 35.31 | 25.15 | 19.25 |
| Value Plus Institutional Class | 9.75 | 8.26 | 7.41 | 10.24 | 4.37 | 8.87 | 35.61 | 25.28 | 19.33 |
| Russell 2000® Value | 9.90 | 7.98 | 9.97 | 10.89 | 8.23 | 18.73 | 43.01 | 22.99 | 17.19 |
*Not annualized
| 2025 (%) | 2024 (%) | 2023 (%) | 2022 (%) | 2021 (%) | 2020 (%) | 2019 (%) | 2018 (%) | 2017 (%) | 2016 (%) | 2015 (%) | 2014 (%) | 2013 (%) | 2012 (%) | 2011 (%) | 2010 (%) | 2009 (%) | 2008 (%) | |
|---|---|---|---|---|---|---|---|---|---|---|---|---|---|---|---|---|---|---|
| Value Plus Investor Class | 1.06 | -0.31 | 1.83 | -4.95 | 24.85 | 12.64 | 26.02 | -13.13 | 9.81 | 26.77 | -17.41 | -2.70 | 34.15 | 11.38 | -5.37 | 28.50 | 26.37 | -17.88 |
| Value Plus Institutional Class | 1.30 | -0.02 | 2.11 | -4.75 | 25.11 | 12.93 | 26.29 | -12.95 | 10.07 | 26.89 | -17.20 | -2.45 | 34.53 | 11.67 | -5.07 | 28.85 | 26.70 | -17.71 |
| Russell 2000® Value | 12.59 | 8.05 | 14.65 | -14.48 | 28.27 | 4.63 | 22.39 | -12.86 | 7.84 | 31.74 | -7.47 | 4.22 | 34.52 | 18.05 | -5.50 | 24.50 | 20.58 | -28.92 |
6/30/2026
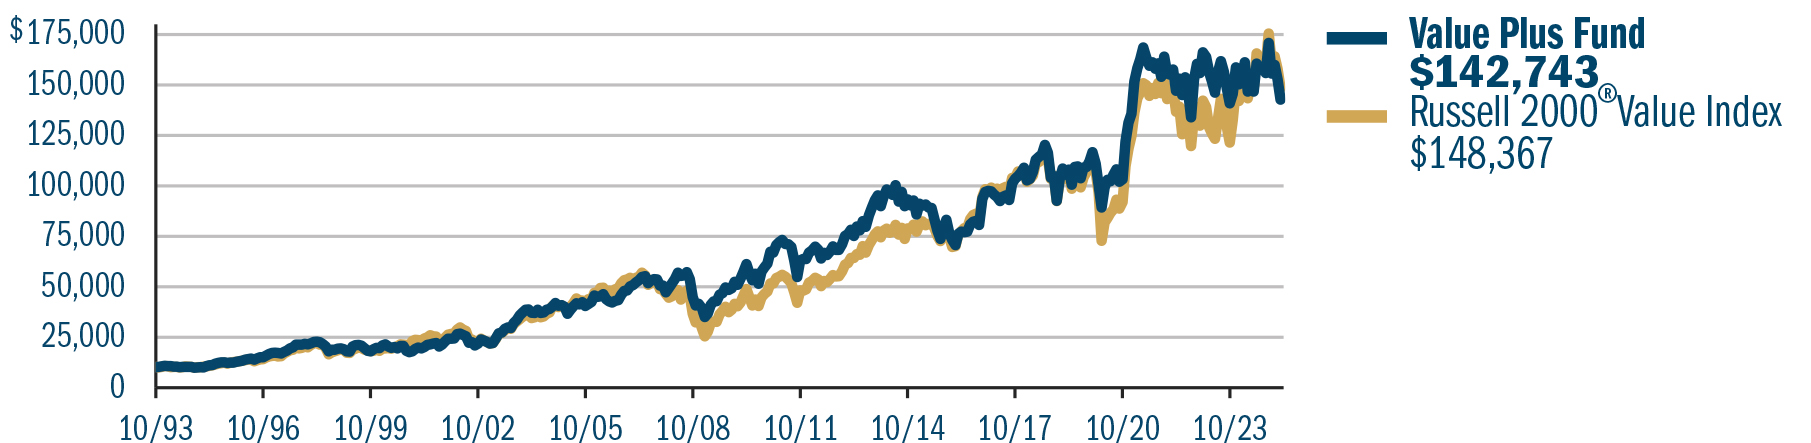
Since inception of the investor class, 10/26/1993 to 6/30/2026
Chart represents a hypothetical example of an investment in the Value Plus Fund representing historical returns
Based on risk-adjusted performance
Past performance does not guarantee future results. Performance represents past performance; current returns may be lower or higher. Performance for institutional class shares prior to their initial offering is based on the performance of investor class shares. The investment return and principal value will fluctuate so that an investor's shares, when redeemed, may be worth more or less than the original cost. All returns reflect reinvested dividends and capital gains distributions, but do not reflect the deduction of taxes that an investor would pay on distributions or redemptions. Subject to certain exceptions, shares of a Fund redeemed or exchanged within 10 days of purchase are subject to a 2% redemption fee. Performance does not reflect this fee, which if deducted would reduce an individual's return. To obtain performance through the most recent month end, call 800-432-7856 or visit heartlandadvisors.com.
In the prospectus dated 5/1/2026, the Gross Fund Operating Expenses for the investor and institutional class of the Value Plus Fund are 1.22% and 0.99%, respectively. The Advisor has voluntarily agreed to waive fees and/or reimburse expenses with respect to the institutional class, to the extent necessary to maintain the institutional class’ “Net Annual Operating Expenses” at a ratio not to exceed 0.99% of average daily net assets. This voluntary waiver/reimbursement may be discontinued at any time. Without such waivers and/or reimbursements, total returns may have been lower.
The inception date for the Value Plus Fund is 10/26/1993 for the investor class and 5/1/2008 for the institutional class.
Contact a Relationship Manager for historical NAVs.
Historical NAVs also are available from third party websites, such as Bloomberg, Yahoo! Finance, or Google Finance.
6/30/2026
Scroll over to view complete data
| Characteristic | Value Plus | Russell 2000® Value |
|---|---|---|
| Holdings | 55 | - |
| Assets | 330 million | - |
| Assets in Dividend-Paying Companies | 79.2% | - |
| Median Market Cap | 6.7 billion | 937 million |
| Weighted Average Market Cap | 8.4 billion | 3.5 billion |
| Trailing 1-Year Turnover | 50.8% | - |
6/30/2026
| Cap Range | % of Equities in Portfolio |
|---|---|
| >$15 billion | 16.0 |
| $2.5-15 billion | 76.2 |
| $500 million-2.5 billion | 7.8 |
| <$500 million | 0.0 |
The above breakdown does not include short-term investments.
6/30/2026
Source: FactSet Research Systems Inc., Russell Investment Group.
Scroll over to view complete data
| Ticker | Holding | % of Net Assets | Industry |
|---|---|---|---|
| MTRN | Materion Corp. | 3.4 | Metals & Mining |
| RPRX | Royalty Pharma Cl A | 3.2 | Pharmaceuticals |
| LAMR | Lamar Advertising Co.(Class A) | 3.1 | Specialized REITs |
| LFUS | Littelfuse, Inc. | 3.0 | Electronic Equipment Instruments & Components |
| FNB | FNB Corp. PA | 3.0 | Banks |
| ASB | Associated Banc-Corp. | 3.0 | Banks |
| RNST | Renasant Corp. | 2.9 | Banks |
| SBCF | Seacoast Banking Corp. of Florida | 2.8 | Banks |
| NVST | Envista Holdings Corp. | 2.6 | Health Care Equipment & Supplies |
| SIMO | Silicon Motion Technology Corp. (ADR) | 2.5 | Semiconductors & Semiconductor Equipment |
| % of Total Net Assets | 29.5 | ||
6/30/2026
Scroll over to view complete data
| Alpha* | Standard Deviation (%)* | Beta | Info Ratio | Sharpe Ratio | Upside Capture (%)* | Downside Capture (%)* | R- Squared (%) | Active Share | |
|---|---|---|---|---|---|---|---|---|---|
| Value Plus | -2.80 | 18.48 | 0.86 | -0.61 | 0.02 | 82.92 | 96.18 | 88.90 | 96.31 |
| Russell 2000® Value | 0.00 | 20.29 | 1 | - | 0.22 | 100 | 100 | 100 | - |
6/30/2026
Scroll over to view complete data
| Alpha* | Standard Deviation (%)* | Beta | Info Ratio | Sharpe Ratio | Upside Capture (%)* | Downside Capture (%)* | R- Squared (%) | Active Share | |
|---|---|---|---|---|---|---|---|---|---|
| Value Plus | -2.56 | 18.49 | 0.86 | -0.57 | 0.04 | 83.41 | 95.84 | 88.91 | 96.31 |
| Russell 2000® Value | 0.00 | 20.29 | 1 | - | 0.22 | 100 | 100 | 100 | - |
*Annualized
Source: FactSet Research Systems Inc., Russell Investment Group
Alpha, beta, and information ratio are versus the Russell 2000® Value. Depiction is for investor and institutional class shares.
| Record Date |
Payable Date |
Ordinary Dividend ($/share) |
Short-Term Capital Gain ($/share) |
Long-Term Capital Gain ($/share) |
|
|---|---|---|---|---|---|
| 12/18/2025 | 12/19/2025 | 0.22343 | - | - | |
| 12/19/2024 | 12/20/2024 | 0.17411 | - | 0.90128 | |
| 12/26/2023 | 12/27/2023 | 0.32742 | - | 0.20363 | |
| 12/27/2022 | 12/28/2022 | 0.17469 | - | 0.65643 | |
| 12/28/2021 | 12/29/2021 | 0.27336 | 3.14654 | 6.30187 | |
| 12/28/2020 | 12/29/2020 | 0.18135 | 0.22560 | - | |
| 12/26/2019 | 12/27/2019 | 0.52086 | - | - | |
| 12/27/2018 | 12/28/2018 | 0.32280 | - | - | |
| 12/27/2017 | 12/28/2017 | 0.04556 | - | - | |
| 12/28/2016 | 12/29/2016 | 0.19593 | - | - | |
| 12/28/2015 | 12/29/2015 | 0.20797 | - | 1.90702 | |
| 12/29/2014 | 12/30/2014 | 0.06825 | 0.30014 | 2.84734 | |
| 12/26/2013 | 12/27/2013 | 0.16431 | 0.54157 | 3.30825 | |
| 12/26/2012 | 12/27/2012 | 0.35668 | 0.20864 | 0.60760 | |
| 12/28/2011 | 12/29/2011 | 0.183006 | - | 0.319936 | |
| 12/30/2010 | 12/31/2010 | 0.078769 | - | - | |
| 12/28/2010 | 12/29/2010 | - | - | 0.160541 | |
| 3/30/2010 | 3/31/2010 | 0.019995 | - | - | |
| 3/30/2010 | 3/31/2010 | 0.001223 | - | - | |
| 12/30/2009 | 12/31/2009 | 0.081006 | - | - | |
| 9/29/2009 | 9/30/2009 | 0.016893 | - | - | |
| 6/29/2009 | 6/30/2009 | 0.013335 | - | - | |
| 3/30/2009 | 3/31/2009 | 0.074305 | - | - | |
| 9/29/2008 | 9/30/2008 | 0.023100 | - | - | |
| 6/27/2008 | 6/30/2008 | 0.031991 | - | - | |
| 3/28/2008 | 3/31/2008 | 0.048473 | - | - | |
| 12/26/2007 | 12/27/2007 | - | 0.366103 | 3.707176 | |
| 9/27/2007 | 9/28/2007 | 0.218534 | 0.213593 | 0.602828 | |
| 6/28/2007 | 6/29/2007 | 0.047600 | - | - | |
| 3/29/2007 | 3/30/2007 | 0.154655 | - | - |
| Record Date |
Payable Date |
Ordinary Dividend ($/share) |
Short-Term Capital Gain ($/share) |
Long-Term Capital Gain ($/share) |
|
|---|---|---|---|---|---|
| 12/18/2025 | 12/19/2025 | 0.32527 | - | - | |
| 12/19/2024 | 12/20/2024 | 0.28011 | - | 0.90128 | |
| 12/26/2023 | 12/27/2023 | 0.42851 | - | 0.20363 | |
| 12/27/2022 | 12/28/2022 | 0.26708 | - | 0.65643 | |
| 12/28/2021 | 12/29/2021 | 0.39348 | 3.14654 | 6.30187 | |
| 12/28/2020 | 12/29/2020 | 0.27869 | 0.22560 | - | |
| 12/26/2019 | 12/27/2019 | 0.59788 | - | - | |
| 12/27/2018 | 12/28/2018 | 0.40925 | - | - | |
| 12/27/2017 | 12/28/2017 | 0.12164 | - | - | |
| 12/28/2016 | 12/29/2016 | 0.22625 | - | - | |
| 12/28/2015 | 12/29/2015 | 0.31363 | - | 1.90702 | |
| 12/29/2014 | 12/30/2014 | 0.18133 | 0.30014 | 2.84734 | |
| 12/26/2013 | 12/27/2013 | 0.28097 | 0.54157 | 3.30825 | |
| 12/26/2012 | 12/27/2012 | 0.45243 | 0.20864 | 0.60760 | |
| 12/28/2011 | 12/29/2011 | 0.284872 | - | 0.319936 | |
| 12/30/2010 | 12/31/2010 | 0.138722 | - | - | |
| 12/28/2010 | 12/29/2010 | - | - | 0.160541 | |
| 3/30/2010 | 3/31/2010 | 0.032692 | - | - | |
| 3/30/2010 | 3/31/2010 | 0.013036 | - | - | |
| 12/30/2009 | 12/31/2009 | 0.093645 | - | - | |
| 9/29/2009 | 9/30/2009 | 0.026711 | - | - | |
| 6/29/2009 | 6/30/2009 | 0.022818 | - | - | |
| 3/30/2009 | 3/31/2009 | 0.118031 | - | - | |
| 9/29/2008 | 9/30/2008 | 0.038800 | - | - | |
| 6/27/2008 | 6/30/2008 | 0.039712 | - | - |
37 years of industry experience
27 years of experience at Heartland
©2026 Heartland Advisors | 790 N. Water Street, Suite 1200, Milwaukee, WI 53202 | Business Office: 414-347-7777 | Financial Professionals: 888-505-5180 | Individual Investors: 800-432-7856
The Value Plus Fund invests in small companies that are generally less liquid and more volatile than large companies. The Fund also invests in a limited number of stocks (generally 40 to 70) than the average mutual fund. The performance of these holdings generally will increase the volatility of the Fund’s returns. There is no assurance that dividened paying stocks will mitigate volatility.
Value investments are subject to the risk that their intrinsic value may not be recognized by the broad market.
There is no assurance that dividend-paying stocks will mitigate volatility.
Certain security valuations and forward estimates are based on Heartland Advisors' calculations. Certain outliers may be excluded. Any forecasts may not prove to be true.
Portfolio holdings are subject to change. Current and future portfolio holdings are subject to risk.
Portfolio holdings exclude cash, cash equivalents, options, and futures.
Information about Morningstar Ratings™ are ©2026 Morningstar, Inc. All rights reserved. The information contained herein is (1) proprietary to Morningstar and/or its content providers; (2) may not be copied or distributed, and (3) is not warranted to be accurate, complete or timely. Neither Morningstar nor its content providers are responsible for any damages or losses arising from any use of this information. Past performance is no guarantee of future results.
The Morningstar Rating™ for funds, or "star rating", is calculated for managed products (including mutual funds, variable annuity and variable life subaccounts, exchange-traded funds, closed-end funds, and separate accounts) with at least a three-year history. Exchange-traded funds and open-ended mutual funds are considered a single population for comparative purposes. It is calculated based on a Morningstar Risk-Adjusted Return measure that accounts for variation in a managed product's monthly excess performance, placing more emphasis on downward variations and rewarding consistent performance. The top 10% of products in each product category receive 5 stars, the next 22.5% receive 4 stars, the next 35% receive 3 stars, the next 22.5% receive 2 stars, and the bottom 10% receive 1 star. The Overall Morningstar Rating for a managed product is derived from a weighted average of the performance figures associated with its three-, five-, and 10-year (if applicable) Morningstar Rating metrics. The weights are: 100% three-year rating for 36-59 months of total returns, 60% five-year rating/40% three-year rating for 60-119 months of total returns, and 50% 10-year rating/30% five-year rating/20% three-year rating for 120 or more months of total returns. While the 10-year overall star rating formula seems to give the most weight to the 10-year period, the most recent three-year period actually has the greatest impact because it is included in all three rating periods.
As of 06/30/2026 Morningstar Ratings™: The Heartland Value Plus Fund Investor class was rated against 453, 432, 362, and 453 U.S.-domiciled Small Value funds for the 3-Year, 5-Year, 10-Year and Overall Ratings, respectively and has Morningstar's 1-star rating for 3-Year, 1-star rating for 5-Year, 3-star rating for 10-Year, and 2-star rating for the Overall.
As of 06/30/2026 Morningstar Ratings™: The Heartland Value Plus Fund Institutional class was rated against 453, 432, 362, and 453 U.S.-domiciled Small Value funds for the 3-Year, 5-Year, 10-Year and Overall Ratings, respectively and has Morningstar's 1-star rating for 3-Year, 1-star rating for 5-Year, 4-star rating for 10-Year, and 3-star rating for the Overall.
Heartland Advisors defines market cap ranges by the following indices: micro-cap by the Russell Microcap®, small-cap by the Russell 2000®, mid-cap by the Russell Midcap®, large-cap by the Russell Top 200®.
The Fund’s performance information included in regulatory filings includes a required index that represents an overall securities market (Regulatory Benchmark). In addition, the Fund's regulatory filings may also include an index that more closely aligns to the Fund's investment strategy (Strategy Benchmark(s)). The Fund's performance included in marketing and advertising materials and information other than regulatory filings is generally compared only to the Strategy Benchmark.
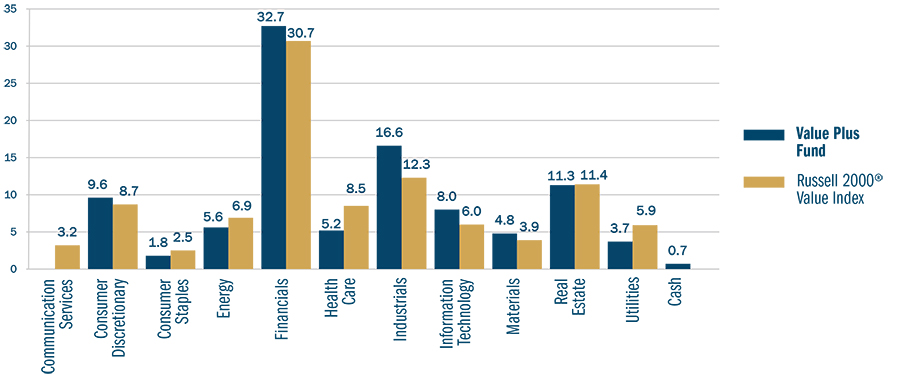
Sector and Industry classifications are sourced from GICS®.The Global Industry Classification Standard (GICS®) is the exclusive intellectual property of MSCI Inc. (MSCI) and S&P Global Market Intelligence (“S&P”). Neither MSCI, S&P, their affiliates, nor any of their third party providers (“GICS Parties”) makes any representations or warranties, express or implied, with respect to GICS or the results to be obtained by the use thereof, and expressly disclaim all warranties, including warranties of accuracy, completeness, merchantability and fitness for a particular purpose. The GICS Parties shall not have any liability for any direct, indirect, special, punitive, consequential or any other damages (including lost profits) even if notified of such damages.
Heartland’s investing glossary provides definitions for several terms used on this page.
The above individuals are registered representatives of ALPS Distributors, Inc.
CFA® is a registered trademark owned by the CFA Institute.
The Heartland Funds are distributed by ALPS Distributors, Inc.
Separately managed accounts and related investment advisory services are provided by Heartland Advisors, Inc., a federally registered investment advisor. ALPS Distributors, Inc., is not affiliated with Heartland Advisors, Inc.


