See standardized performance at the end.
If you looked at a report on all the stocks that contributed to our performance in the second quarter, and then reversed the results, you’d have a good sense of how the third quarter played out for our Fund as well as small caps in general.
After soaring more than 20% in the spring, the Russell 2000® Index sank 7.23% over the past three months, as the AI momentum trade unwound and the market rotated into other sectors that had been largely overlooked in recent months. Within our benchmark, the Russell 2000® Value Index, Energy and Health Care were the two best-performing sectors in the third quarter, after being among the worst in Q2. Meanwhile, Technology went from leading the market earlier in the year to being one of its biggest laggards in the summer.
There was a silver lining to the stormy quarter. While it was a difficult period for small stocks on an absolute and relative basis, the backdrop for value-minded investors like us improved noticeably. That might sound surprising, given the challenging quarter we experienced over the past three months. Yet, as investors began to question some of their speculative bets on AI from earlier in the year, higher-quality stocks have been gaining renewed interest. Moreover, as interest rates climbed on persistent inflation worries, fundamental factors such as valuations, debt, and actual earnings growth began to matter more to investors, as it becomes more difficult to mask weak balance sheets and poor operational efficiency with cheap financing.
Meanwhile, as the AI trade faltered in the quarter, the market began to broaden out, and there are signs this may not be a short-term blip, but rather a longer-term trend as improved market participation is being supported by corporate profits. Historically, there has been a strong correlation between earnings breadth and improvement in the Institute for Supply Management’s Manufacturing Purchasing Managers’ Index (PMI) (see the chart below).
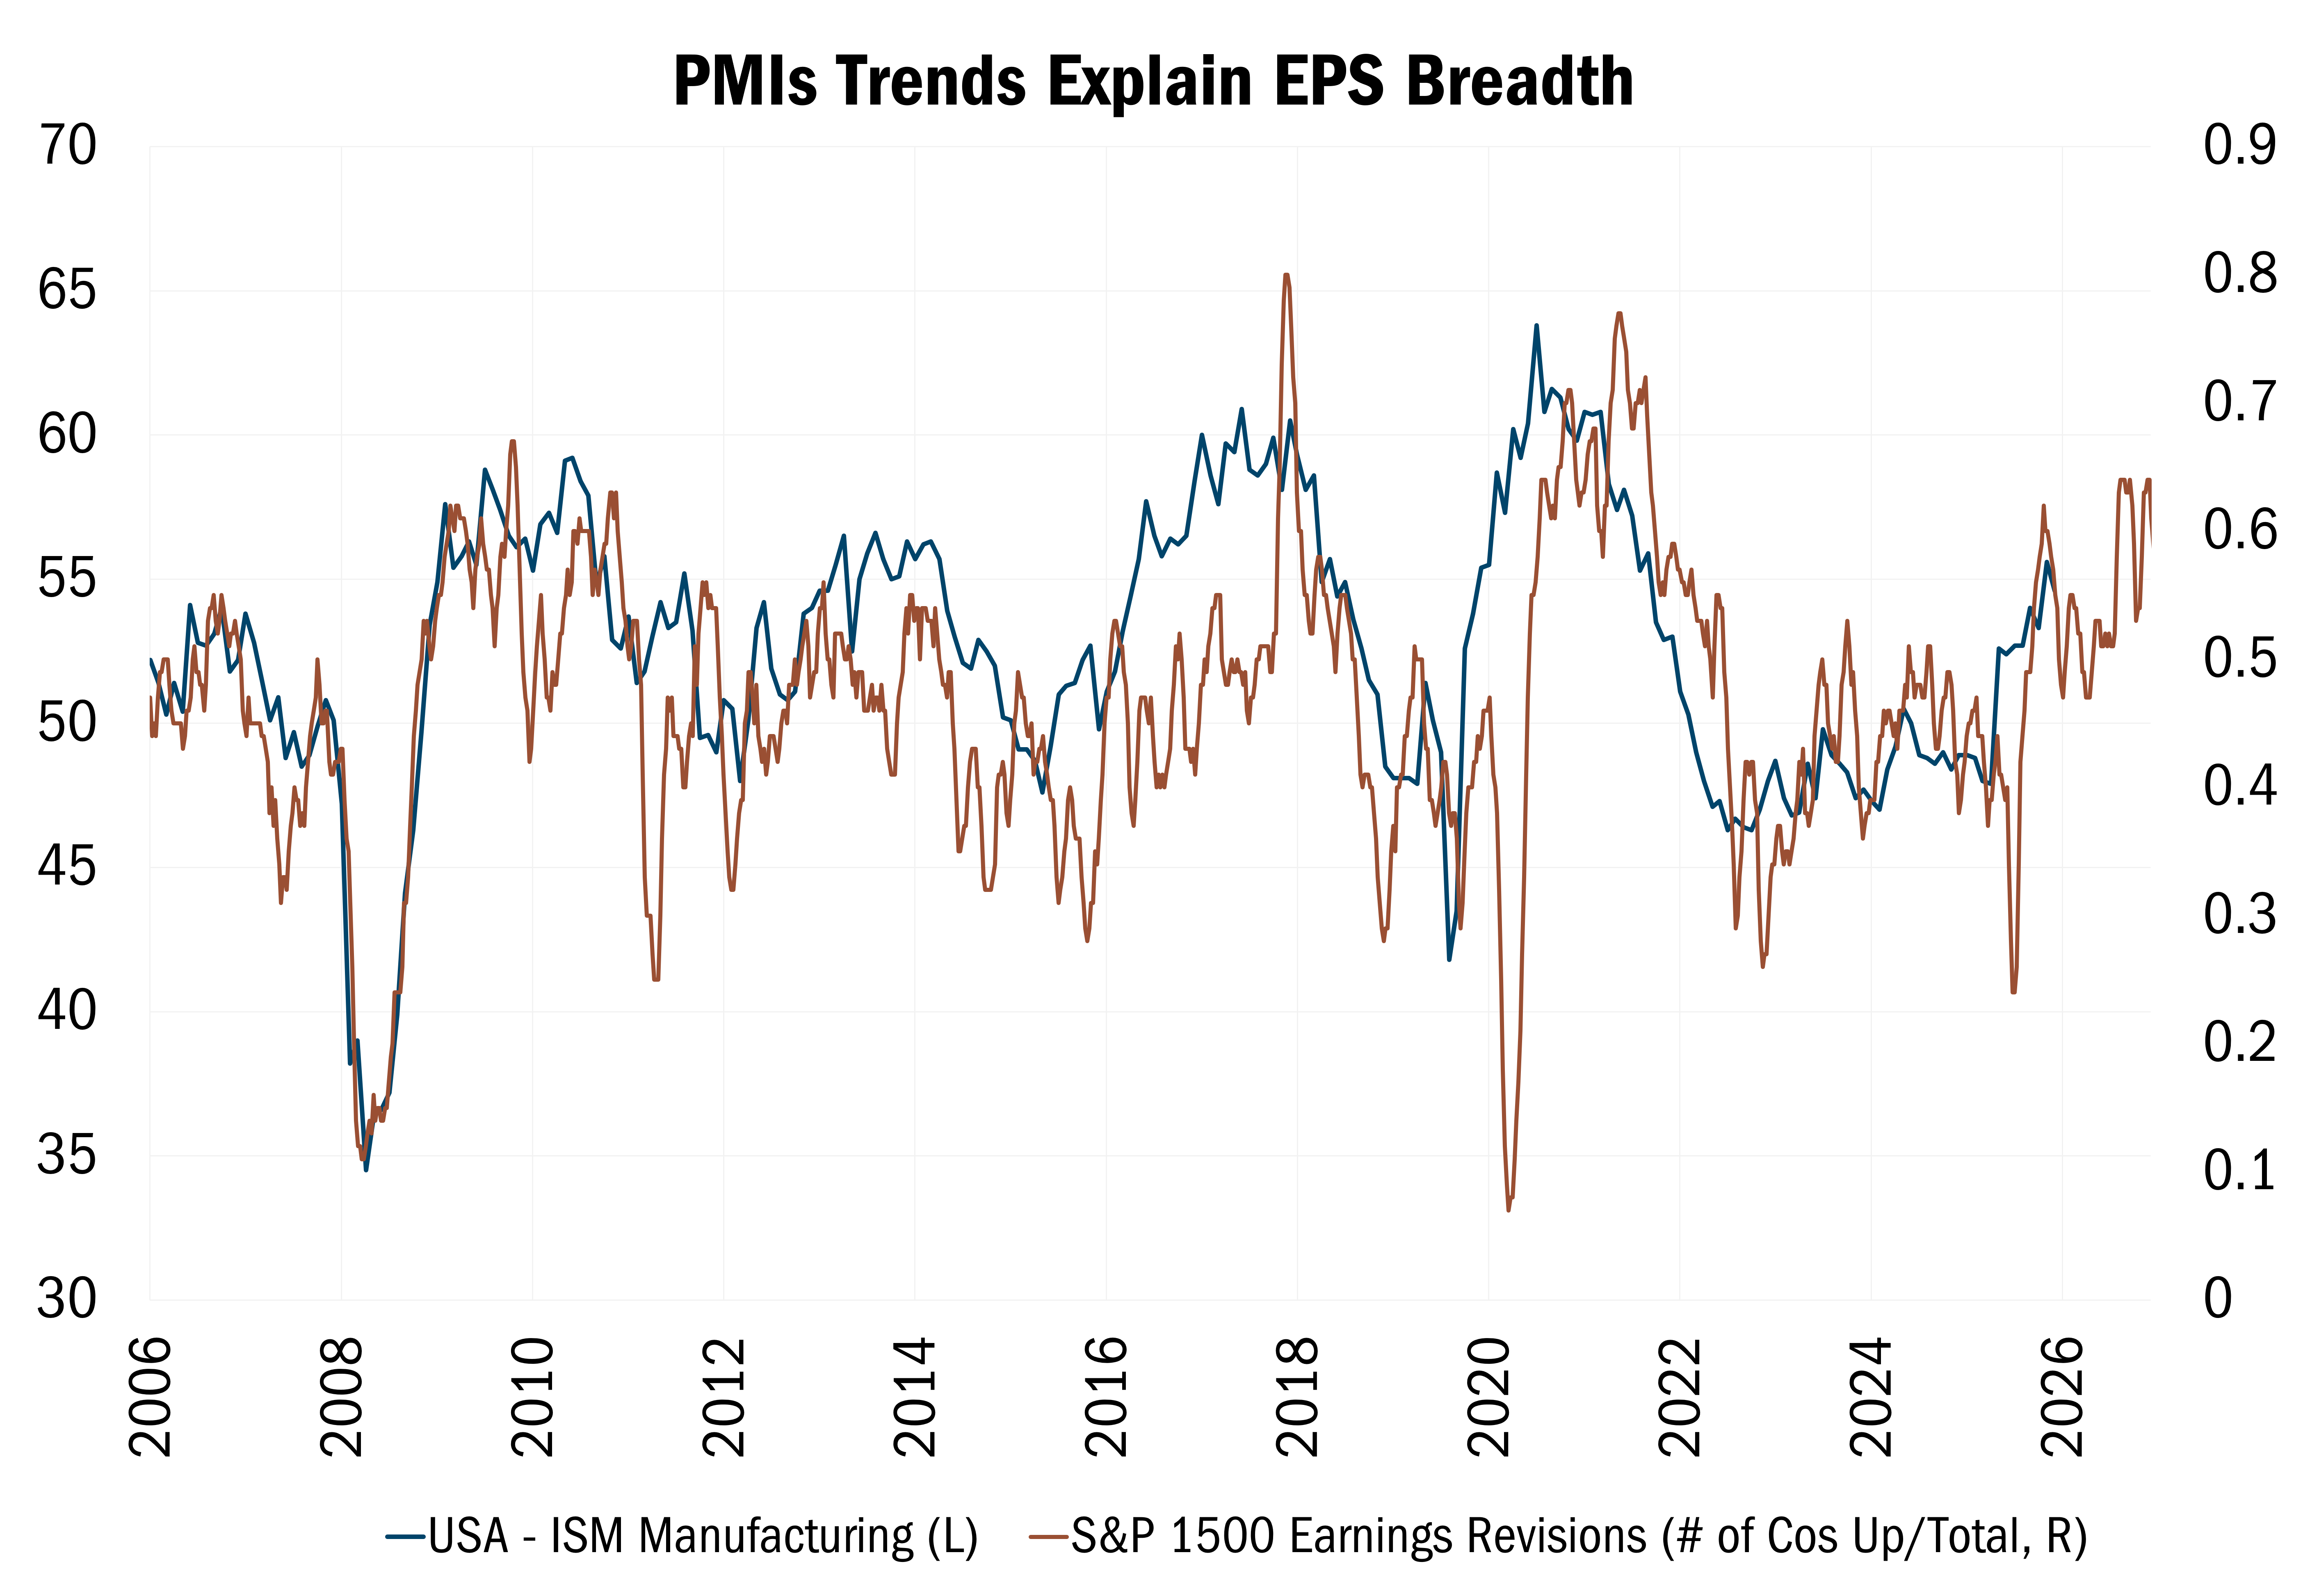
Source: Piper Sandler & Co. Weekly data 9/29/2006 to 9/25/2026. The data in this chart Compares PMI trends with the breadth of S&P 1500 earnings revisions over time to illustrate their relationship. Purchasing Managers Index (PMI) is an indicator of the economic health of the manufacturing sector based on five major indicators: new orders, inventory levels, production, supplier deliveries and the employment environment. ISM Manufacturing Index is based on surveys of more than 300 manufacturing firms by the Institute of Supply Management. The ISM Manufacturing Index monitors employment, production inventories, new orders and supplier deliveries. A composite diffusion index is created that monitors conditions in national manufacturing based on the data from these surveys. S&P Composite 1500 combines three leading indices, the S&P 500, the S&P MidCap 400, and the S&P SmallCap 600 to cover approximately 90% of the U.S. market capitalization. All indices are unmanaged. It is not possible to invest in an index. Past performance does not guarantee future results.
However, there are plenty of macro concerns that remain, including rising interest rates, high oil prices, and weakening consumer confidence. But the industrial economy remains strong, as does nominal and real GDP. Based on the cumulative change in PMI from its recent trough, history suggests the current PMI cycle could just be starting to unfold (see the chart below).
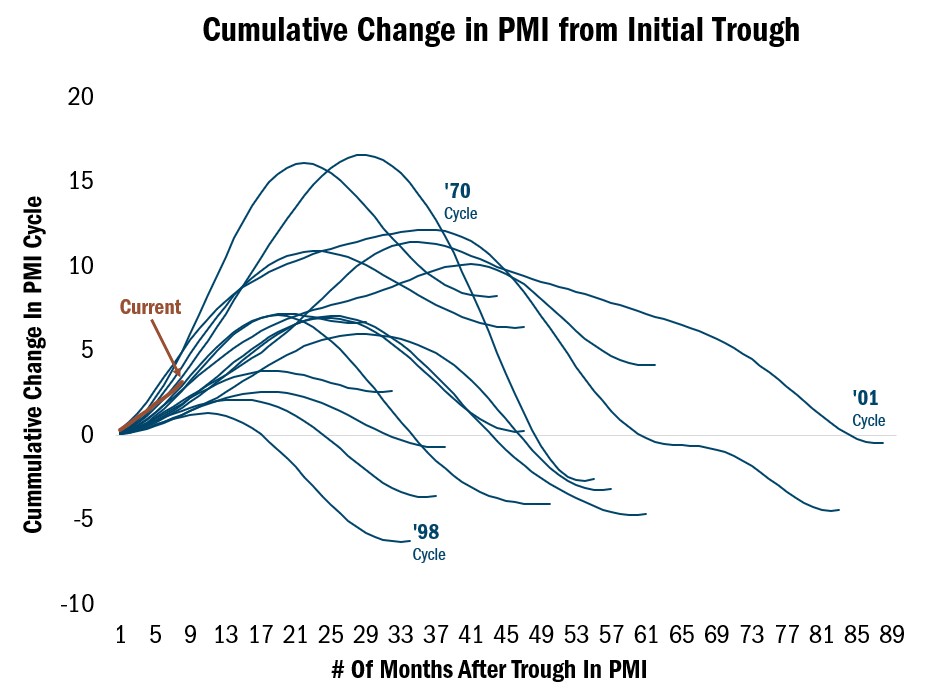
Source: Piper Sandler & Co. Monthly data 6/30/1960 to 9/25/2026. The data in this chart how much PMI has changed after its trough across different historical economic cycles. All indices are unmanaged. It is not possible to invest in an index. Past performance does not guarantee future results.
The bottom line: Fundamentals seem to be back in focus. One thing we’ve been noticing is that even upward earnings revisions aren’t enough to save stocks trading at high multiples. Profit growth still matters, but the market is increasingly demanding reasonable valuations as well - this is welcome news for long-term oriented, fundamentally driven investors. This is especially true for us, given our adherence to our 10 Principles of Value Investing™, which directs us to high-quality companies with strong balance sheets, low debt, and competitive advantages while trading at attractive prices.
The Value Plus Fund fell 8.26% in the third quarter, compared with the 4.91% loss for the Russell 2000® Value Index. That underperformance was largely the result of stock selection. In the quarter, our negative selection effect was most pronounced in Energy, Consumer Discretionary, and Industrials. By contrast, our selection effect was positive in Real Estate, Financials, and Materials.
One thing that became evident was that fundamental characteristics that had been overlooked throughout the year, such as free cash flow yield, started to pay off in the quarter. Other quality factors such as return on equity, return on investments, and return on assets have also held up since the end of June.
An example of a high-quality company in our portfolio that also happens to benefit from an improving PMI is Quaker Houghton (KWR). As a leading supplier of fluids used in metal production and metalworking processes, Quaker should capitalize on a jump in industrial production. The steel industry is KWR’s top end market, along with general manufacturers and vehicle original equipment manufacturers (OEMs). The company’s products represent a small cost in the production process, but for end users, they are mission critical. If these fluids are not used properly, they can ruin an entire batch of metal. KWR aims to add value by bringing employees on site to help them ensure the chemicals are used correctly.
Until recently, the ISM Manufacturing PMI has been contracting since 2022, impacting the company’s volume and profitability. The new CEO, who took over last year, used this difficult period to focus the company’s efforts on things that they can directly control, like providing a better value proposition to its customers to take market share from competitors and cut costs. Quaker has now had 12 consecutive quarters of revenue growth ahead of its end-market growth, which we believe sets the company up to perform well as improved PMI leads to gains in end-market demand.
Yet, KWR is currently trading at less than 10 times next year’s EBITDA, even though it has historically traded around 12 times EV/EBITDA. As industrial production levels improve, we see upside from higher earnings and potential for a re-rating closer to its historic average multiple. Meanwhile, management is giving us further confidence through share buybacks and a 17th consecutive year of raising dividends.
Another company buying back stock and boosting payouts—two of the three metrics we look for in capital allocation, along with insider buying—is Hanover (THG). This property and commercial insurance company focuses on small- to medium-sized businesses. We believe the company is threading the needle by managing to raise the premiums it charges while also growing volume in a slow and steady manner. Yet the stock is trading at a discount on earnings. Should THG hit our price target, its price/earnings ratio would still be just 13 times, based on an average of 2026 and 2027 earnings per share.
One of our Fund’s Technology holdings, Tyler Technologies (TYL), is a leading provider of software solutions and services to public sector organizations, including school districts, city and county offices, and law enforcement.
TYL’s shares lost around half their value since August 2025 amid fears that generative AI tools could disrupt software businesses like this. But we believe the market has overly discounted the company’s future prospects. In fact, we think AI could actually provide a meaningful tailwind for TYL’s fundamentals, in the form of revenue growth and margin expansion, as the software maker begins to use and deploy its own AI products. For its part, management has stated that AI could nearly double their total addressable market.
Meanwhile, due to high switching costs, strained resources, and compliance burdens, public sector entities are slower than private to adopt new technology, and TYL offers the data, domain expertise, and technical knowledge to be their customers’ AI provider of choice. Giving us further confidence, insider buying began to accelerate in February while the company executed $755 million of its $1.5 billion repurchase authorization in the first half of 2026.
One of the biggest detractors to our performance was Primo Brands (PRMB), a leading U.S. hydration company, which offers consumers water through five-gallon jugs, refill stations, and ready-to-drink formats.
This was a volatile quarter for the stock. The company sold off early in the quarter on concerns related to execution and rising input costs, but subsequently PRMB beat earnings expectations, causing the stock to rise. Later, a large shareholder announced plans to liquidate a portion of its position through a secondary offering, which put pressure on the stock. Management chose to participate in the secondary offering, effectively buying back stock from the selling shareholder, while the CEO further demonstrated confidence by personally purchasing more than $2 million in shares in the open market following the sell-off.
We remain committed to the stock on the strength of improving fundamentals, insider buying, active buybacks and an increasing dividend. Moreover, the company is trading at just 7.5 times EV/EBITDA, a significant discount to its 10-year average multiple of 10 times.
Despite the challenges we faced in the third quarter, we believe this is a fertile environment for our Strategy. An improving economy, coupled with a broadening market, renewed focus on fundamentals, and a greater appreciation for valuations is precisely the backdrop that disciplined active managers like us covet. This is a market that requires research, judgement, and the flexibility to adjust. We continue to see solid opportunities, but we also recognize the need to stay true to our 10 Principles of Value Investing™. We seek to manage risk while directing capital only to businesses with a solid foundation for long-term returns.
Scroll over to view complete data
| Since Inception (%) | 20-Year (%) | 15-Year (%) | 10-Year (%) | 5-Year (%) | 3-Year (%) | 1-Year (%) | YTD* (%) | QTD* (%) | |
|---|---|---|---|---|---|---|---|---|---|
| Value Plus Investor Class | 9.24 | 7.49 | 8.40 | 8.31 | 3.05 | 7.37 | 14.40 | 14.81 | -8.26 |
| Value Plus Institutional Class | 9.39 | 7.73 | 8.65 | 8.56 | 3.30 | 7.63 | 14.65 | 14.99 | -8.21 |
| Russell 2000® Value | 9.65 | 7.58 | 11.38 | 9.40 | 7.80 | 17.93 | 20.77 | 16.96 | -4.91 |
*Not annualized
Source: FactSet Research Systems Inc., Russell®, and Heartland Advisors, Inc.
The inception date for the Value Plus Fund is 10/26/1993 for the investor class and 5/1/2008 for the institutional class.
In the prospectus dated 5/1/2026, the Gross Fund Operating Expenses for the investor and institutional class of the Value Plus Fund are 1.22% and 0.99%, respectively. The Advisor has voluntarily agreed to waive fees and/or reimburse expenses with respect to the institutional class, to the extent necessary to maintain the institutional class’ “Net Annual Operating Expenses” at a ratio not to exceed 0.99% of average daily net assets. This voluntary waiver/reimbursement may be discontinued at any time. Without such waivers and/or reimbursements, total returns may have been lower.
Past performance does not guarantee future results. Performance represents past performance; current returns may be lower or higher. Performance for institutional class shares prior to their initial offering is based on the performance of investor class shares. The investment return and principal value will fluctuate so that an investor's shares, when redeemed, may be worth more or less than the original cost. All returns reflect reinvested dividends and capital gains distributions, but do not reflect the deduction of taxes that an investor would pay on distributions or redemptions. Subject to certain exceptions, shares of a Fund redeemed or exchanged within 10 days of purchase are subject to a 2% redemption fee. Performance does not reflect this fee, which if deducted would reduce an individual's return. To obtain performance through the most recent month end, call 800-432-7856 or visit heartlandadvisors.com.


©2026 Heartland Advisors | 790 N. Water Street, Suite 1200, Milwaukee, WI 53202 | Business Office: 414-347-7777 | Financial Professionals: 888-505-5180 | Individual Investors: 800-432-7856
In the prospectus dated 5/1/2026, the Gross Fund Operating Expenses for the investor and institutional class of the Value Plus Fund are 1.22% and 0.99%, respectively. The Advisor has voluntarily agreed to waive fees and/or reimburse expenses with respect to the institutional class, to the extent necessary to maintain the institutional class’ “Net Annual Operating Expenses” at a ratio not to exceed 0.99% of average daily net assets. This voluntary waiver/reimbursement may be discontinued at any time. Without such waivers and/or reimbursements, total returns may have been lower.
Past performance does not guarantee future results. Performance represents past performance; current returns may be lower or higher. Performance for institutional class shares prior to their initial offering is based on the performance of investor class shares. The investment return and principal value will fluctuate so that an investor's shares, when redeemed, may be worth more or less than the original cost. All returns reflect reinvested dividends and capital gains distributions, but do not reflect the deduction of taxes that an investor would pay on distributions or redemptions. Subject to certain exceptions, shares of a Fund redeemed or exchanged within 10 days of purchase are subject to a 2% redemption fee. Performance does not reflect this fee, which if deducted would reduce an individual's return. To obtain performance through the most recent month end, call 800-432-7856 or visit heartlandadvisors.com.
An investor should consider the Funds’ investment objectives, risks, and charges and expenses carefully before investing or sending money. This and other important information may be found in the Funds' prospectus. To obtain a prospectus, please call 800-432-7856 or visit heartlandadvisors.com. Please read the prospectus carefully before investing.
As of 9/30/2026, The Hanover Insurance Group, Inc. (THG), Primo Brands Corp (Class A) (PRMB), Quaker Houghton (KWR), and Tyler Technologies (TYL), represented 2.52%, 1.76%, 2.12%, and 2.14% of the Value Plus Fund’s net assets, respectively.
Statements regarding securities are not recommendations to buy or sell.
Portfolio holdings are subject to change. Current and future holdings are subject to risk.
The Value Plus Fund invests in small companies that are generally less liquid and more volatile than large companies. The Fund also invests in a smaller number of stocks (generally 40 to 70) than the average mutual fund. The performance of these holdings generally will increase the volatility of the Fund’s returns.
Value investments are subject to the risk that their intrinsic value may not be recognized by the broad market.
The Value Plus Fund seeks long-term capital appreciation and modest current income.
The Fund’s performance information included in regulatory filings includes a required index that represents an overall securities market (Regulatory Benchmark). In addition, the Fund's regulatory filings may also include an index that more closely aligns to the Fund's investment strategy (Strategy Benchmark(s)). The Fund's performance included in marketing and advertising materials and information other than regulatory filings is generally compared only to the Strategy Benchmark.
The above individuals are registered representatives of ALPS Distributors, Inc.
The Heartland Funds are distributed by ALPS Distributors, Inc.
The statements and opinions expressed in this article are those of the presenter(s). Any discussion of investments and investment strategies represents the presenters’ views as of the date created and are subject to change without notice. The opinions expressed are for general information only and are not intended to provide specific advice or recommendations for any individual. The specific securities discussed, which are intended to illustrate the advisor’s investment style, do not represent all of the securities purchased, sold, or recommended by the advisor for client accounts, and the reader should not assume that an investment in these securities was or would be profitable in the future. Certain security valuations and forward estimates are based on Heartland Advisors’ calculations. Any forecasts may not prove to be true.
Economic predictions are based on estimates and are subject to change.
There is no guarantee that a particular investment strategy will be successful.
Sector and Industry classifications are sourced from GICS®.The Global Industry Classification Standard (GICS®) is the exclusive intellectual property of MSCI Inc. (MSCI) and S&P Global Market Intelligence (“S&P”). Neither MSCI, S&P, their affiliates, nor any of their third party providers (“GICS Parties”) makes any representations or warranties, express or implied, with respect to GICS or the results to be obtained by the use thereof, and expressly disclaim all warranties, including warranties of accuracy, completeness, merchantability and fitness for a particular purpose. The GICS Parties shall not have any liability for any direct, indirect, special, punitive, consequential or any other damages (including lost profits) even if notified of such damages.
Heartland Advisors defines market cap ranges by the following indices: micro-cap by the Russell Microcap®, small-cap by the Russell 2000®, mid-cap by the Russell Midcap®, large-cap by the Russell Top 200®.
Because of ongoing market volatility, performance may be subject to substantial short-term changes.
Dividends are not guaranteed and a company’s future ability to pay dividends may be limited. A company currently paying dividends may cease paying dividends at any time.
In certain cases, dividends and earnings are reinvested.
There is no assurance that dividend-paying stocks will mitigate volatility.
CFA® is a registered trademark owned by the CFA Institute.
Russell Investment Group is the source and owner of the trademarks, service marks and copyrights related to the Russell Indices. Russell® is a trademark of the Frank Russell Investment Group.
Absolute Value is a business valuation method that uses discounted cash flow analysis to determine a company's financial worth. Absolute value models try to determine a company's intrinsic worth based on its projected cash flows. Artificial intelligence (AI) is intelligence—perceiving, synthesizing, and inferring information—demonstrated by computers, as opposed to intelligence displayed by humans or by other animals. Buyback is the repurchase of outstanding shares (repurchase) by a company in order to reduce the number of shares on the market. Cyclical Stocks cover Basic Materials, Capital Goods, Communications, Consumer Cyclical, Energy, Financial, Technology, and Transportation which tend to react to a variety of market conditions that can send them up or down and often relate to business cycles. Earnings Quality refers to the ability of reported earnings to reflect the company's true earnings. Earnings Before Interest, Taxes, Depreciation and Amortization (EBITDA) measures a company’s financial performance. It is used to analyze and compare profitability between companies and industries because it eliminates the effects of financing and accounting decisions. Enterprise Value/Earnings Before Interest, Taxes, Depreciation, and Amortization (EV/EBITDA) Ratio is a financial indicator used to determine the value of a company and is calculated by dividing the entire economic value of the company (enterprise value) by its earnings before interest, taxes, depreciation, and amortization (EBITDA). Free Cash Flow is the amount of cash a company has after expenses, debt service, capital expenditures, and dividends. The higher the free cash flow, the stronger the company’s balance sheet. Free Cash Flow Yield is calculated as the amount of cash a company has after expenses, debt service, capital expenditures, and dividends divided by either its current market price per share or enterprise value. Gross Domestic Product (GDP) is the monetary value of all the finished goods and services produced within a country’s borders in a specific time period, though GDP is usually calculated on an annual basis. Insider Buying is the purchase of a company's stock by individual directors, executives or other employees. Momentum is the rate of acceleration of a security's price or trade volume. Original Equipment Manufacturer (OEM) is a company whose goods are used as components in the products of another company, which then sells the finished item to users. Purchasing Managers Index is an indicator of the economic health of the manufacturing sector based on five major indicators: new orders, inventory levels, production, supplier deliveries and the employment environment. Relative Value is a method of determining an asset's value that takes into account the value of similar assets. Calculations that are used to measure the relative value of stocks include the enterprise ratio and price-to-earnings ratio. Russell Investment Group is the source and owner of the trademarks, service marks and copyrights related to the Russell Indices. Russell® is a trademark of the Russell Investment Group. Russell 2000® Index includes the 2000 firms from the Russell 3000® Index with the smallest market capitalizations. All indices are unmanaged. It is not possible to invest directly in an index. Russell 2000® Value Index measures the performance of those Russell 2000® companies with lower price/book ratios and lower forecasted growth characteristics. All indices are unmanaged. It is not possible to invest directly in an index. Selection Effect of the Attribution Analysis is the portion of the portfolio excess return attributable to choosing different securities within groups from the benchmark. Volatility is a statistical measure of the dispersion of returns for a given security or market index which can either be measured by using the standard deviation or variance between returns from that same security or market index. Commonly, the higher the volatility, the riskier the security. 10 Principles of Value Investing™ consist of the following criteria for selecting securities: (1) catalyst for recognition; (2) low price in relation to earnings; (3) low price in relation to cash flow; (4) low price in relation to book value; (5) financial soundness; (6) positive earnings dynamics; (7) sound business strategy; (8) capable management and insider ownership; (9) value of company; and (10) positive technical analysis.
Data sourced from FactSet: Copyright 2026 FactSet Research Systems Inc., FactSet Fundamentals. All rights reserved.
Heartland’s investing glossary provides definitions for several terms used on this page.