See standardized performance at the end.
The late, great investor Charlie Munger famously observed that “the big money is not in the buying and the selling, but in the waiting.” We agree. In fact, for much of this year, we’ve been patiently and hopefully waiting for demand dynamics in the economy to improve to create a tailwind for small businesses, many of which have already been put through a recession-like wringer.
In the interim, our attention has been focused on secular winners with self-help strategies in place. We define secular winners as companies that are growing their top line or taking market share in a down market. Self-help strategies are initiatives that could lead to margin improvements regardless of economic conditions. And if growth does rebound, these businesses are likely to get an added boost.
Recently, we have seen signs that conditions are starting to improve. As the chart below shows, companies in the S&P 600 Index of small stocks are seeing the first signs of year-over-year growth in three years — and the strongest profit outlook since the end of the global pandemic.
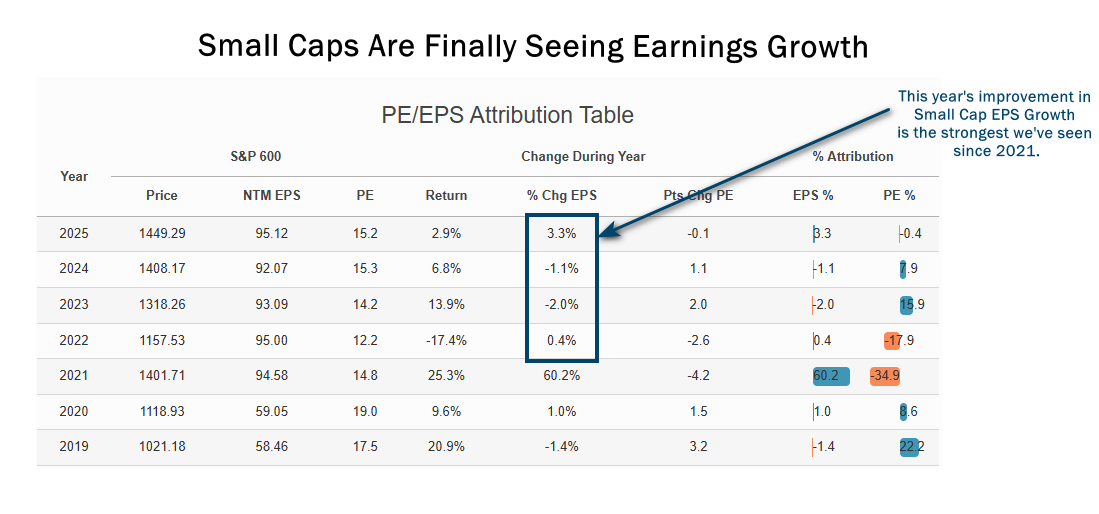
Source: Piper Sandler. Data from FactSet Research Systems Inc. and Compustat, yearly data from 1/1/2019 to 9/30/2025. This data shows the S&P 600’s price, NTM P/E, and NTM EPS estimate each year, measuring the change in both P/Es and EPS in a given year to arrive at that year’s price return. The S&P 600 is an index of small-cap stocks managed by Standard & Poor's. It tracks a broad range of small-sized companies that meet specific liquidity and stability requirements. This is determined by specific metrics such as public float, market capitalization, and financial viability, among other factors. All indices are unmanaged. It is not possible to invest directly in an index. Past performance does not guarantee future results.
It seems as though we might finally be through the worst of the earnings trough. And now that the Federal Reserve has ended its long pause and eased rates for the first time since late last year, small companies are likely to be beneficiaries of lower financing costs along with a growing appetite for risk-taking that typically comes with a rate-cutting cycle.
Not surprisingly, the third quarter turned out to be a strong one for small-caps, with the Russell 2000® Index up 12.39% in the quarter, outperforming the S&P 500 Index, which rose 8.12%.
It’s probably too soon to say if the switch has flipped. In our case, most of the companies we own tend to be prepared for the worst and hope for the best. Right now, they find themselves somewhere in between. The economic backdrop isn’t exactly pedal to the metal, but the demand environment looks solid. And if companies can marry that with smart capital allocation decisions and effective self-help strategies, that should be a recipe for success. We seek to build in another layer of safety by relying on our 10 Principles of Value Investing™, which is designed to lead us to financially sound, well-run businesses with positive profit dynamics that are also trading at attractive prices relative to earnings, book value and cash flow.
The Value Plus Fund gained 8.51% in the third quarter, compared with the 12.60% gain for the Russell 2000® Value Index. Our stock selection was positive in several sectors led by Financials, Information Technology, Utilities, and Materials, which accounted for our top five performing holdings in the quarter. By contrast, the selection effect was negative in Health Care, Energy, Real Estate, Industrials, Consumer Staples, and Consumer Discretionary, which accounted for our five worst-performing stocks this quarter.
Our stock selection performs best when any optimism surrounding the improving fundamentals of companies we’re watching are confirmed by the actions of management. That can come in several forms, including active share buybacks (indicating management believes the stock is undervalued), insider buying (a sign that executive leaders believe the stock is a good value and willing to put their own money on the line), and growing dividends (a sign of management’s confidence in their future profits and cash flow). Currently, roughly one-third of our holdings in the Strategy have insider buying; 84% of our companies are in active buyback mode; and 61% have increased their dividends in the past year.
These are companies like Brady Corp. (BRC), a leading manufacturer of ID solutions and workplace safety products. In our view, the company is allocating capital wisely: They are actively buying back stock, consistently increasing dividends, and pursuing tuck-in acquisitions that complement their core business — all while maintaining low leverage.
The company’s core business is identification solutions for commercial products, allowing clients to trace and track parts. Brady’s niche is printers and related consumables such as labels for rugged industrial markets. This has been a year of restructuring and cost cutting for Brady, which is part of the company’s self-help story. Recently, management has called out strong growth in Aerospace and Data Center end markets, with the Data Center strength focused on BRC’s wire marking business.
We believe the company will begin to reap the benefits of these efforts starting next year, and in its most recent quarterly earnings announcement, Brady reported 2026 guidance that was above expectations. Still, the stock trades at a reasonable valuation. Our current price target for BRC would represent 18x our 2026 EPS estimate.
Another example is Phinia Inc. (PHIN), an auto parts company spun off from Borg Warner in 2023 that makes fuel systems for vehicle manufacturers and the after-market. In our opinion, the market has been overly pessimistic on PHIN’s outlook in the aftermath of President Trump’s ‘Liberation Day’ announcements on tariffs, and large insider purchases by the company’s CEO and two directors helped confirm our view.
We believe PHIN has a variety of ways to win, especially relative to other companies in the auto parts category. In its legacy auto OEM business, PHIN is the third player in a three-company oligopoly that collectively controls roughly 80%-90% market share. The second-biggest player in this group has deemphasized this category since COVID-19, resulting in 4%-5% market share gains for PHIN. We believe this trend is likely to continue, and PHIN could control around 20% of the market by 2030, up from the mid-teens today.
The company also has considerable exposure to the relatively stable after-market auto parts end-market, which accounts for approximately 40% of the company’s revenues and close to half of its operating profits. We believe Phinia’s after-market business could grow at a mid-single digit percentage CAGR with less cyclicality, as it is based on replacement of critical engine components. Additionally, PHIN has multiple revenue growth opportunities in under-penetrated end-markets such as aerospace, off-highway vehicles and hybrid vehicles that were overlooked as part of the much larger Borg Warner entity.
Following PHIN’s spin-off, management has executed on cost savings initiatives to improve margins and used free cash flow to consistently buyback stock and de-lever the balance sheet. PHIN is hitting on all three of the main capital allocation criteria we look for, which gives us even more confidence. Yet the stock is trading at a modest 6x EV/EBITDA. We believe PHIN is being valued by the market as an OEM auto parts manufacturer even though that exposure is less than 30% of revenue. As PHIN’s after-market and industrial end-market exposures continue to grow, we think PHIN should receive a multiple closer to after-market auto parts and industrial companies that trade in the 8-12x EV/EBITDA range.
Our top performer for the quarter was Materion Corp. (MTRN), a vertically integrated producer of high-performance advanced engineered materials based on beryllium, a rare metal that is one-third lighter than aluminum but has six times the stiffness of steel.
MTRN has been taking several steps to improve operations and bolster margins during a slower overall period for some of its end markets, such as autos, industrials, and life sciences. Over the past year, as demand has remained subdued, management divested its unprofitable Architectural Glass business in New Mexico while expanding high-margin capacity for advanced semiconductor capabilities in South Korea. The stock recently experienced outsized strength post tariff fears as Materion produced record margins with guidance for accelerating growth as a variety of end markets have visibility to a sustained rebound in demand.
Though the stock has bounced back, it’s still trading at an attractive price. If MTRN shares reach our target, that would still be a just 1.7x FY 2026 sales and 12x EBITDA.
Prestige Consumer Healthcare (PBH) — the company behind familiar over-the-counter medical products such as Dramamine, Luden’s cough drops, and Clear Eyes eye drops — was the biggest detractor to our Strategy’s performance during the quarter. That’s in part because PBH missed earnings forecasts and took down its full fiscal year EPS estimates due to supply chain issues related to its eye care business. Its core supplier was not able to ship enough products to meet demand for PBH’s Clear Eyes business.
The company took action to fix this supply chain issue, opting to acquire its eye care supplier for $100 million. This former supplier will now be 100% focused on producing for PBH after being brought in-house. We expect PBH’s FY 2027 earnings to bounce back nicely as the core business is operating well and expect a rebound in PBH’s profitable eye care business as customers re-stock inventory. At its price of $63 at the end of the third quarter, Prestige shares were trading at 13.8 times 2027 earnings. But we expect multiple expansion, as the company earnings are set to accelerate after addressing its supply chain issues.
For months, we’ve been waiting for green shoots to emerge, and we’re starting to see signs of hope. Still, we believe this is not time to overreact. Despite initial signs of improvement in demand dynamics, we are not looking to catch falling knives. We’re still committed to identifying good companies with strong capital allocation plans in place that are reducing costs, improving their margins, and taking market share — regardless of how well the economy is doing. Self-help, though, is just one factor that we covet. As always, we are guided by our 10 Principles of Value Investing™, which helps direct us to undervalued companies with low debt, high-quality balance sheets, and competitive advantages that are useful against any backdrop.
Thank you for your continued trust and confidence in us.
Scroll over to view complete data
Source: FactSet Research Systems Inc., Russell®, and Heartland Advisors, Inc.
The inception date for the Value Plus Fund is 10/26/1993 for the investor class and 5/1/2008 for the institutional class.
©2026 Heartland Advisors | 790 N. Water Street, Suite 1200, Milwaukee, WI 53202 | Business Office: 414-347-7777 | Financial Professionals: 888-505-5180 | Individual Investors: 800-432-7856
In the prospectus dated 5/1/2026, the Gross Fund Operating Expenses for the investor and institutional class of the Value Plus Fund are 1.22% and 0.99%, respectively. The Advisor has voluntarily agreed to waive fees and/or reimburse expenses with respect to the institutional class, to the extent necessary to maintain the institutional class’ “Net Annual Operating Expenses” at a ratio not to exceed 0.99% of average daily net assets. This voluntary waiver/reimbursement may be discontinued at any time. Without such waivers and/or reimbursements, total returns may have been lower.
Past performance does not guarantee future results. Performance represents past performance; current returns may be lower or higher. Performance for institutional class shares prior to their initial offering is based on the performance of investor class shares. The investment return and principal value will fluctuate so that an investor's shares, when redeemed, may be worth more or less than the original cost. All returns reflect reinvested dividends and capital gains distributions, but do not reflect the deduction of taxes that an investor would pay on distributions or redemptions. Subject to certain exceptions, shares of a Fund redeemed or exchanged within 10 days of purchase are subject to a 2% redemption fee. Performance does not reflect this fee, which if deducted would reduce an individual's return. To obtain performance through the most recent month end, call 800-432-7856 or visit heartlandadvisors.com.
An investor should consider the Funds’ investment objectives, risks, and charges and expenses carefully before investing or sending money. This and other important information may be found in the Funds' prospectus. To obtain a prospectus, please call 800-432-7856 or visit heartlandadvisors.com. Please read the prospectus carefully before investing.
As of 9/30/2025, Brady Corp. (Class A) (BRC), Materion Corp. (MTRN), Phinia Inc. (PHIN), Prestige Consumer Healthcare (PBH), represented 2.64%, 3.07%, 1.95%, and 1.27% of the Value Plus Fund’s net assets, respectively.
Statements regarding securities are not recommendations to buy or sell.
Portfolio holdings are subject to change. Current and future holdings are subject to risk.
The Value Plus Fund invests in small companies that are generally less liquid and more volatile than large companies. The Fund also invests in a smaller number of stocks (generally 40 to 70) than the average mutual fund. The performance of these holdings generally will increase the volatility of the Fund’s returns.
Value investments are subject to the risk that their intrinsic value may not be recognized by the broad market.
The Value Plus Fund seeks long-term capital appreciation and modest current income.
The Fund’s performance information included in regulatory filings includes a required index that represents an overall securities market (Regulatory Benchmark). In addition, the Fund's regulatory filings may also include an index that more closely aligns to the Fund's investment strategy (Strategy Benchmark(s)). The Fund's performance included in marketing and advertising materials and information other than regulatory filings is generally compared only to the Strategy Benchmark.
The above individuals are registered representatives of ALPS Distributors, Inc.
The Heartland Funds are distributed by ALPS Distributors, Inc.
The statements and opinions expressed in this article are those of the presenter(s). Any discussion of investments and investment strategies represents the presenters’ views as of the date created and are subject to change without notice. The opinions expressed are for general information only and are not intended to provide specific advice or recommendations for any individual. The specific securities discussed, which are intended to illustrate the advisor’s investment style, do not represent all of the securities purchased, sold, or recommended by the advisor for client accounts, and the reader should not assume that an investment in these securities was or would be profitable in the future. Certain security valuations and forward estimates are based on Heartland Advisors’ calculations. Any forecasts may not prove to be true.
Economic predictions are based on estimates and are subject to change.
There is no guarantee that a particular investment strategy will be successful.
Sector and Industry classifications are sourced from GICS®.The Global Industry Classification Standard (GICS®) is the exclusive intellectual property of MSCI Inc. (MSCI) and S&P Global Market Intelligence (“S&P”). Neither MSCI, S&P, their affiliates, nor any of their third party providers (“GICS Parties”) makes any representations or warranties, express or implied, with respect to GICS or the results to be obtained by the use thereof, and expressly disclaim all warranties, including warranties of accuracy, completeness, merchantability and fitness for a particular purpose. The GICS Parties shall not have any liability for any direct, indirect, special, punitive, consequential or any other damages (including lost profits) even if notified of such damages.
Heartland Advisors defines market cap ranges by the following indices: micro-cap by the Russell Microcap®, small-cap by the Russell 2000®, mid-cap by the Russell Midcap®, large-cap by the Russell Top 200®.
Because of ongoing market volatility, performance may be subject to substantial short-term changes.
Dividends are not guaranteed and a company’s future ability to pay dividends may be limited. A company currently paying dividends may cease paying dividends at any time.
In certain cases, dividends and earnings are reinvested.
There is no assurance that dividend-paying stocks will mitigate volatility.
CFA® is a registered trademark owned by the CFA Institute.
Russell Investment Group is the source and owner of the trademarks, service marks and copyrights related to the Russell Indices. Russell® is a trademark of the Frank Russell Investment Group.
Data sourced from FactSet: Copyright 2026 FactSet Research Systems Inc., FactSet Fundamentals. All rights reserved.
Best EPS is Bloomberg’s estimates of earnings per share for the current period. Book Value is the sum of all of a company’s assets, minus its liabilities. Buyback is the repurchase of outstanding shares (repurchase) by a company in order to reduce the number of shares on the market. Compound Annual Growth Rate (CAGR) is the rate of return that an investment would need to have every year in order to grow from its beginning balance to its ending balance, over a given time interval. Cyclical Stocks cover Basic Materials, Capital Goods, Communications, Consumer Cyclical, Energy, Financial, Technology, and Transportation which tend to react to a variety of market conditions that can send them up or down and often relate to business cycles. Earnings Before Interest, Taxes, Depreciation and Amortization (EBITDA) measures a company’s financial performance. It is used to analyze and compare profitability between companies and industries because it eliminates the effects of financing and accounting decisions. Free Cash Flow is the amount of cash a company has after expenses, debt service, capital expenditures, and dividends. The higher the free cash flow, the stronger the company’s balance sheet. Leverage is the amount of debt used to finance a firm's assets. A firm with significantly more debt than equity is considered to be highly leveraged. Net Margin is the ratio of net profits to revenues for a company or business segment - typically expressed as a percentage – that shows how much of each dollar earned by the company is translated into profits. Margin of Safety is a principle of investing in which an investor only purchases securities when the market price is significantly below its intrinsic value. Original Equipment Manufacturer (OEM) is a company that produces parts and components for other companies' products. Russell 2000® Index includes the 2000 firms from the Russell 3000® Index with the smallest market capitalizations. All indices are unmanaged. It is not possible to invest directly in an index. Russell 2000® Value Index measures the performance of those Russell 2000® companies with lower price/book ratios and lower forecasted growth characteristics. All indices are unmanaged. It is not possible to invest directly in an index. S&P 500 Index is an index of 500 U.S. stocks chosen for market size, liquidity and industry group representation and is a widely used U.S. equity benchmark. All indices are unmanaged. It is not possible to invest directly in an index. 10 Principles of Value Investing™ consist of the following criteria for selecting securities: (1) catalyst for recognition; (2) low price in relation to earnings; (3) low price in relation to cash flow; (4) low price in relation to book value; (5) financial soundness; (6) positive earnings dynamics; (7) sound business strategy; (8) capable management and insider ownership; (9) value of company; and (10) positive technical analysis.
Heartland’s investing glossary provides definitions for several terms used on this page.


