See standardized performance at the end.
The second quarter proved to be a strong one for small stocks, with the Russell 2000® Index up 21.49%, outpacing the 15.20% gain for the S&P 500 Index. While casual observers may argue this was a low-quality rally, where speculative stocks outperformed high-quality names amid the euphoria surrounding AI, that’s not what we’re focused on. Nor are we frustrated by it.
Yes, the artificial intelligence trade continues to be powerful, and the percentage of profitable companies in the Russell 2000® that are beating the benchmark has fallen (see the chart below). Yet the chart also shows that not all strong businesses are being left behind. And as active managers, it’s our job to identify them. The good news is, we are finding opportunities.
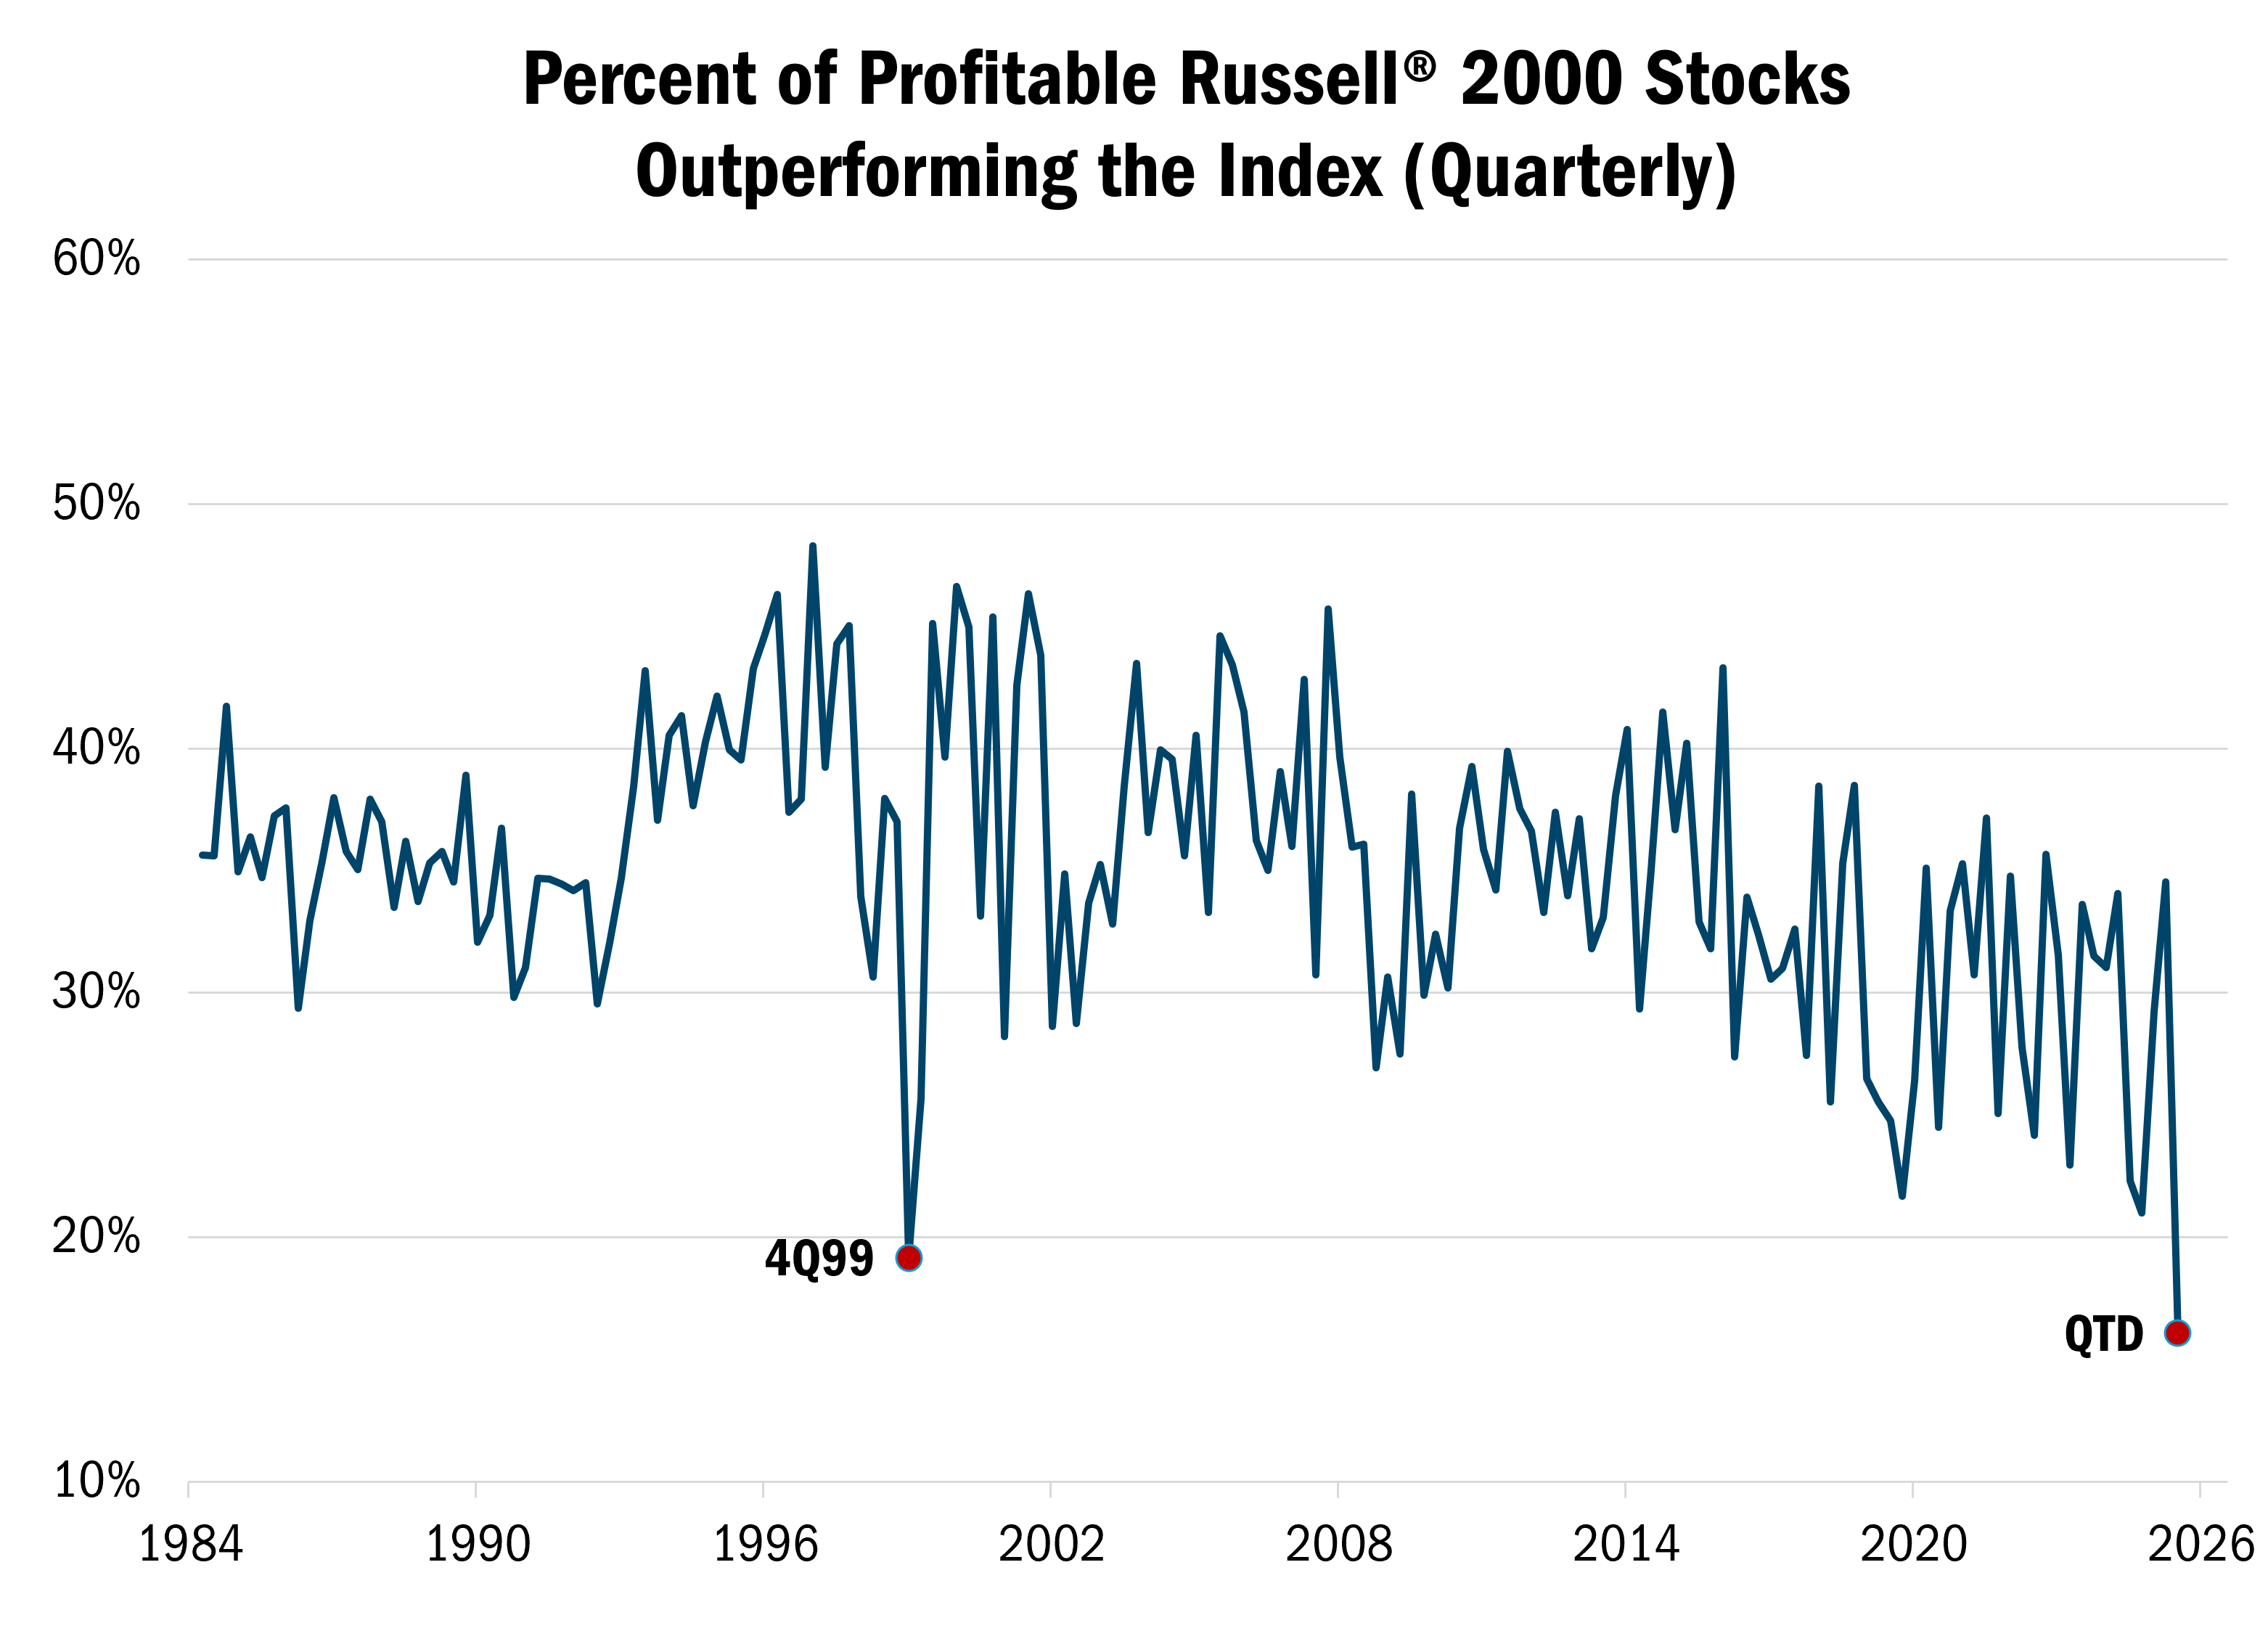
Source: Furey Research Systems, quarterly data 12/31/1984 to 6/2/2026. The data in this chart shows the percentage of profitable Russell® 2000 Stocks outperforming the index on a quarterly basis. Profitable can be described as when a business’s total revenue exceeds its total expenses. All indices are unmanaged. It is not possible to invest in an index. Past performance does not guarantee future results.
Meanwhile, small cap value now seems to be participating in a strengthening economic environment, which represents a promising tailwind, as we are finding compelling ways to participate in a variety of industries, even in Technology. The second quarter was good illustration of this, as five of the six biggest contributors to our Strategy were semiconductor manufacturers or electrical component manufacturers benefitting from the AI infrastructure buildout.
It should be noted that we have held many of these names for several years (some for more than a decade), well before the AI phenomenon materialized. In our opinion, these are companies that aren’t just well-positioned within their distinct segments of the Tech ecosystem, they also have strong balance sheets and employ strong capital allocation policies.
This is an example of how our 10 Principles of Value Investing™, which drives all portfolio decisions, are relevant in various markets. In “low-quality” rallies like this, our 10 Principles of Value Investing™ not only help us manage risk, but they also help direct us to stocks that are bucking the trends and are outperforming because of strong fundamentals factors, such as attractive valuations, healthy balance sheets, and positive earnings dynamics.
The Value Plus Fund rose 19.25% in the second quarter, compared with the 17.19% return for the Russell 2000® Value Index. Much of that outperformance was a result of benchmark-beating gains among our Materials, Energy, and Real Estate holdings, where our stock selection was positive and pronounced.
Our selection effect was negative in Technology, but our holdings in that sector were still up 69.01% in the quarter, trailing the 78.52% Tech gains for the Russell 2000® Value Index. The Strategy also enjoyed a slight boost from our 12.77% weighting in that sector, which was slightly higher than the benchmark’s.
Many of our top performers in Technology were long-standing holdings that have recently added Data Centers as a new end market. An example is Littelfuse (LFUS), an electronics component supplier specializing in power management fuses for electrical products.
The company’s products have historically been used in telecommunications, consumer electronics, and the industrial sectors. What has gotten the market’s attention lately are Littelfuse’s high-medium voltage protection products, which are key to the AI data center buildout. A few years ago, the company’s data center/grid utility infrastructure sales were largely immaterial. Today, that has grown to around 20% of the business and is highly profitable.
The stock has surged 40% since the end of March, after the company delivered a very strong quarter. Bookings are up more than 20% year over year while EPS continues to rise. Just as important, management is using those growing earnings to return cash to shareholders through rising dividends and stock buybacks. Yet even after large stock gains over the past 12 months, LFUS continues to trade at a discount to its peers, which are sporting an average multiple of nearly 40X earnings.
An example of the types of prospects we are seeing outside of Tech is FirstCash (FCFS), which couldn’t be further away from the AI trade.
FirstCash is the largest pawn shop operator in the world. As many consumers struggle with rising inflation, pawn loan demand is likely to remain strong. Meanwhile, gold jewelry remains the dominant collateral asset across FirstCash store fronts. And high gold prices allow FCFS to issue larger loans and collect larger fees.
The company recently reported another strong quarter and raised guidance across the board. Pawn fees were up 39% year over year boosted by strong gold prices. Even better, management is using increased earnings to return cash to shareholders via a rising dividend in addition to stock buybacks. Better still, if the economy were to hit a speedbump, we would expect FCFS to hold up well due to its business model.
Despite its recent price appreciation, FCFS still trades at 13x EBITDA using our 2026-2027 EBITDA estimates. This is in line with its long-term averages, and we believe this demonstrates that the price appreciation is following earnings growth. Meanwhile, management continues to grow the dividend and has an active buyback program in place.
Another non-AI holding is Century Communities (CCS), a Denver-based builder of single-family homes predominantly in the West, Southwest, Mountain states, and Southeast. High mortgage rates and concerns about home affordability have kept demand for new houses tempered. As a result of the poor sentiment, CCS shares are trading at less than 1X book value—0.81X to be exact.
We do not know when demand for housing will pick up or what will happen with interest rates. What we do know is that these historically low valuation levels are attracting patient, long-term capital, resulting in multiple take-outs in the space in the past six months. Berkshire Hathaway, for instance, recently acquired public homebuilder Taylor Morrison at 1.1X book value, and the Japanese conglomerate Sumitomo acquired Tri Pointe Homes for 1.2X book value.
We believe this is a sign that near-term pessimism is fully priced into current valuations, and some of these stocks offer considerable long-term value when conditions do improve. Even small improvements in housing demand should provide meaningful upside. In the meantime, CCS continues to hit two of our three capital allocation signals by buying back stock at these discounted valuations while continuing to grow the dividend.
As disciplined investors, we don’t chase the shiny objects that have become the darlings of the AI trade. But as active managers, we are committed to participating in any environment, so long as it aligns with our approach, as laid out by our 10 Principles of Value Investing™. Thankfully, we continue to find opportunities that adhere to our 10 Principles in every sector, allowing us to partake in this rally while managing risk and identifying attractively valued companies that could be left behind.
Scroll over to view complete data
| Since Inception (%) | 20-Year (%) | 15-Year (%) | 10-Year (%) | 5-Year (%) | 3-Year (%) | 1-Year (%) | YTD* (%) | QTD* (%) | |
|---|---|---|---|---|---|---|---|---|---|
| Value Plus Investor Class | 9.24 | 7.49 | 8.40 | 8.31 | 3.05 | 7.37 | 14.40 | 14.81 | -8.26 |
| Value Plus Institutional Class | 9.39 | 7.73 | 8.65 | 8.56 | 3.30 | 7.63 | 14.65 | 14.99 | -8.21 |
| Russell 2000® Value | 9.65 | 7.58 | 11.38 | 9.40 | 7.80 | 17.93 | 20.77 | 16.96 | -4.91 |
*Not annualized
Source: FactSet Research Systems Inc., Russell®, and Heartland Advisors, Inc.
The inception date for the Value Plus Fund is 10/26/1993 for the investor class and 5/1/2008 for the institutional class.
In the prospectus dated 5/1/2026, the Gross Fund Operating Expenses for the investor and institutional class of the Value Plus Fund are 1.22% and 0.99%, respectively. The Advisor has voluntarily agreed to waive fees and/or reimburse expenses with respect to the institutional class, to the extent necessary to maintain the institutional class’ “Net Annual Operating Expenses” at a ratio not to exceed 0.99% of average daily net assets. This voluntary waiver/reimbursement may be discontinued at any time. Without such waivers and/or reimbursements, total returns may have been lower.
Past performance does not guarantee future results. Performance represents past performance; current returns may be lower or higher. Performance for institutional class shares prior to their initial offering is based on the performance of investor class shares. The investment return and principal value will fluctuate so that an investor's shares, when redeemed, may be worth more or less than the original cost. All returns reflect reinvested dividends and capital gains distributions, but do not reflect the deduction of taxes that an investor would pay on distributions or redemptions. Subject to certain exceptions, shares of a Fund redeemed or exchanged within 10 days of purchase are subject to a 2% redemption fee. Performance does not reflect this fee, which if deducted would reduce an individual's return. To obtain performance through the most recent month end, call 800-432-7856 or visit heartlandadvisors.com.


©2026 Heartland Advisors | 790 N. Water Street, Suite 1200, Milwaukee, WI 53202 | Business Office: 414-347-7777 | Financial Professionals: 888-505-5180 | Individual Investors: 800-432-7856
In the prospectus dated 5/1/2026, the Gross Fund Operating Expenses for the investor and institutional class of the Value Plus Fund are 1.22% and 0.99%, respectively. The Advisor has voluntarily agreed to waive fees and/or reimburse expenses with respect to the institutional class, to the extent necessary to maintain the institutional class’ “Net Annual Operating Expenses” at a ratio not to exceed 0.99% of average daily net assets. This voluntary waiver/reimbursement may be discontinued at any time. Without such waivers and/or reimbursements, total returns may have been lower.
Past performance does not guarantee future results. Performance represents past performance; current returns may be lower or higher. Performance for institutional class shares prior to their initial offering is based on the performance of investor class shares. The investment return and principal value will fluctuate so that an investor's shares, when redeemed, may be worth more or less than the original cost. All returns reflect reinvested dividends and capital gains distributions, but do not reflect the deduction of taxes that an investor would pay on distributions or redemptions. Subject to certain exceptions, shares of a Fund redeemed or exchanged within 10 days of purchase are subject to a 2% redemption fee. Performance does not reflect this fee, which if deducted would reduce an individual's return. To obtain performance through the most recent month end, call 800-432-7856 or visit heartlandadvisors.com.
An investor should consider the Funds’ investment objectives, risks, and charges and expenses carefully before investing or sending money. This and other important information may be found in the Funds' prospectus. To obtain a prospectus, please call 800-432-7856 or visit heartlandadvisors.com. Please read the prospectus carefully before investing.
As of 6/30/2026 Century Communities (CCS), FirstCash (FCFS), and Littelfuse, Inc. (LFUS) represented 1.95%, 2.29% and 3.03% of the Value Plus Fund’s net assets, respectively. Berkshire Hathaway, Inc. (Class B) (BRK/B) is unowned by the Value Plus Fund.
Statements regarding securities are not recommendations to buy or sell.
Portfolio holdings are subject to change. Current and future holdings are subject to risk.
The Value Plus Fund invests in small companies that are generally less liquid and more volatile than large companies. The Fund also invests in a smaller number of stocks (generally 40 to 70) than the average mutual fund. The performance of these holdings generally will increase the volatility of the Fund’s returns.
Value investments are subject to the risk that their intrinsic value may not be recognized by the broad market.
The Value Plus Fund seeks long-term capital appreciation and modest current income.
The Fund’s performance information included in regulatory filings includes a required index that represents an overall securities market (Regulatory Benchmark). In addition, the Fund's regulatory filings may also include an index that more closely aligns to the Fund's investment strategy (Strategy Benchmark(s)). The Fund's performance included in marketing and advertising materials and information other than regulatory filings is generally compared only to the Strategy Benchmark.
The above individuals are registered representatives of ALPS Distributors, Inc.
The Heartland Funds are distributed by ALPS Distributors, Inc.
The statements and opinions expressed in this article are those of the presenter(s). Any discussion of investments and investment strategies represents the presenters’ views as of the date created and are subject to change without notice. The opinions expressed are for general information only and are not intended to provide specific advice or recommendations for any individual. The specific securities discussed, which are intended to illustrate the advisor’s investment style, do not represent all of the securities purchased, sold, or recommended by the advisor for client accounts, and the reader should not assume that an investment in these securities was or would be profitable in the future. Certain security valuations and forward estimates are based on Heartland Advisors’ calculations. Any forecasts may not prove to be true.
Economic predictions are based on estimates and are subject to change.
There is no guarantee that a particular investment strategy will be successful.
Sector and Industry classifications are sourced from GICS®.The Global Industry Classification Standard (GICS®) is the exclusive intellectual property of MSCI Inc. (MSCI) and S&P Global Market Intelligence (“S&P”). Neither MSCI, S&P, their affiliates, nor any of their third party providers (“GICS Parties”) makes any representations or warranties, express or implied, with respect to GICS or the results to be obtained by the use thereof, and expressly disclaim all warranties, including warranties of accuracy, completeness, merchantability and fitness for a particular purpose. The GICS Parties shall not have any liability for any direct, indirect, special, punitive, consequential or any other damages (including lost profits) even if notified of such damages.
Heartland Advisors defines market cap ranges by the following indices: micro-cap by the Russell Microcap®, small-cap by the Russell 2000®, mid-cap by the Russell Midcap®, large-cap by the Russell Top 200®.
Because of ongoing market volatility, performance may be subject to substantial short-term changes.
Dividends are not guaranteed and a company’s future ability to pay dividends may be limited. A company currently paying dividends may cease paying dividends at any time.
In certain cases, dividends and earnings are reinvested.
There is no assurance that dividend-paying stocks will mitigate volatility.
CFA® is a registered trademark owned by the CFA Institute.
Russell Investment Group is the source and owner of the trademarks, service marks and copyrights related to the Russell Indices. Russell® is a trademark of the Frank Russell Investment Group.
Artificial intelligence (AI) is intelligence perceiving, synthesizing, and inferring information demonstrated by computers, as opposed to intelligence displayed by humans or by other animals. Bottom-up is an investment approach that de-emphasizes the significance of economic and market cycles. This approach focuses on the analysis of individual stocks and the investor focuses his or her attention on a specific company rather than on the industry in which that company operates or on the economy as a whole. Buyback is the repurchase of outstanding shares (repurchase) by a company in order to reduce the number of shares on the market. Cyclical Stocks cover Basic Materials, Capital Goods, Communications, Consumer Cyclical, Energy, Financial, Technology, and Transportation which tend to react to a variety of market conditions that can send them up or down and often relate to business cycles. Earnings Before Interest, Taxes, Depreciation and Amortization (EBITDA) measures a company’s financial performance. It is used to analyze and compare profitability between companies and industries because it eliminates the effects of financing and accounting decisions. Enterprise Value (EV) is the entire economic value of a company. Insider Buying is the purchase of a company's stock by individual directors, executives or other employees. Margin of Safety is a principle of investing in which an investor only purchases securities when the market price is significantly below its intrinsic value. The ISM Purchasing Manager's Index (PMI) is a key economic indicator that gauges the health of the manufacturing sector in the United States, based on a monthly survey of purchasing and supply executives. ISM Manufacturing PMI (Purchasing Managers Index) is an index based on surveys of more than 400 manufacturing firms by the Institute for Supply Management (ISM). The PMI index is an indicator of the economic health of the manufacturing sector based on five major indicators: new orders, inventory levels, production, supplier deliveries and the employment environment. A reading over 50 represents that the industry is expanding, under 50 represents a contraction, while a reading at 50 represents no change. Russell Investment Group is the source and owner of the trademarks, service marks and copyrights related to the Russell Indices. Russell® is a trademark of the Russell Investment Group. Russell 2000® Index includes the 2000 firms from the Russell 3000® Index with the smallest market capitalizations. All indices are unmanaged. It is not possible to invest directly in an index. Russell 2000® Value Index measures the performance of those Russell 2000® companies with lower price/book ratios and lower forecasted growth characteristics. All indices are unmanaged. It is not possible to invest directly in an index. S&P 500 Index is an index of 500 U.S. stocks chosen for market size, liquidity and industry group representation and is a widely used U.S. equity benchmark. All indices are unmanaged. It is not possible to invest directly in an index. Selection Effect of the Attribution Analysis is the portion of the portfolio excess return attributable to choosing different securities within groups from the benchmark. 10 Principles of Value Investing™ consist of the following criteria for selecting securities: (1) catalyst for recognition; (2) low price in relation to earnings; (3) low price in relation to cash flow; (4) low price in relation to book value; (5) financial soundness; (6) positive earnings dynamics; (7) sound business strategy; (8) capable management and insider ownership; (9) value of company; and (10) positive technical analysis.
Data sourced from FactSet: Copyright 2026 FactSet Research Systems Inc., FactSet Fundamentals. All rights reserved.
Heartland’s investing glossary provides definitions for several terms used on this page.