See standardized performance at the end.
Improving market breadth, which started to take shape at the end of last year, carried into the first quarter, with the Russell 2000® Index up 0.89% versus the S&P 500 Index which fell 4.33%.
The outbreak of war in Iran, however, seems to have clouded the picture. Since the military action began at the end of February, the broad market and small-cap companies have begun to slump. Yet history tells us not to overreact to short-term and unpredictable geopolitical developments. Time is better spent focusing on those factors that actually drive the markets in the long run. On that basis, there remains hope.
For instance, the underlying economy now appears to be broadening as well, confirming what improved market breadth had been signaling. Heading into the year, there were concerns about the uneven nature of the recovery, with high-net-worth households thriving thanks in part to growing asset values, while working class consumers have been struggling due to persistent inflationary pressures and affordability concerns. This divide has been referred to as the ‘K-shaped’ recovery.
Anecdotally, however, some companies that serve households in the bottom part of the K have reported seeing signs of green shoots forming this year. At the very least, some of the stresses on this segment of the economy no longer appear to be worsening. Lower-income households should also see a lift with the impending arrival of tax rebate checks, which disproportionately benefit the working class, though rising prices at the pump since the start of the war may have a counteracting effect.
Another sign of the broadening economy can be found in the health of the Industrials sector. For more than two years, the Institute for Supply Management’s Purchasing Managers’ Index (PMI) has been indicating contraction in factory activity. So far this year, though, the PMI for manufacturing has enjoyed back-to-back readings above 50, marking the first signs of growth in back-to-back months in four years. Even better, 90% of the individual PMI readings across various parts of the economy signaled strength during the first quarter. These are levels we have not seen since early 2022 (see the chart below).
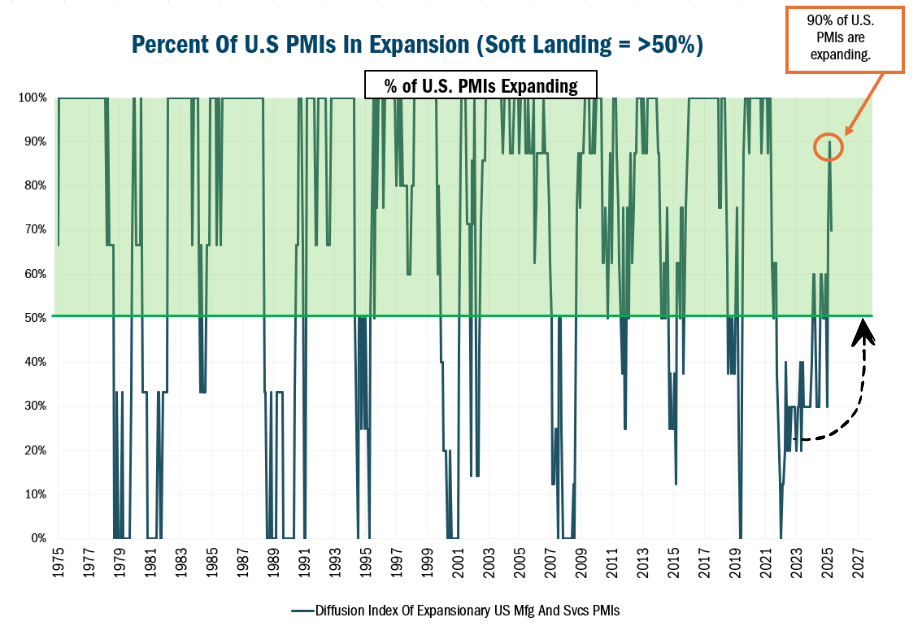
Source: FactSet Research Systems Inc. via Piper Sandler Monthly data 12/31/1975 to 3/31/2026. The data in this chart shows a diffusion index highlighting how many of the US PMIs (Dallas, Richmond, Philly, Chicago, Kansas, Empire) are currently in expansion relative to the total possible number. Regional US Purchasing Managers' Indices (PMIs) are monthly, localized economic indicators surveying manufacturing or service sector purchasing managers about business conditions. The ISM Services Index (formerly Non-Manufacturing Index or NMI) is a monthly economic indicator based on surveys of purchasing managers across U.S. The ISM Manufacturing Index, or Purchasing Managers' Index (PMI), is a monthly economic indicator based on surveys of purchasing managers at roughly 300–400 U.S. manufacturing firms. The S&P Global US Services PMI (formerly Markit) is a key monthly economic indicator gauging the private service sector's health, with a January 2026 reading of 52.70, indicating expansion. The S&P Global (formerly Markit) US Manufacturing PMI indicates the health of the manufacturing sector, with a January 2026 reading of 52.4, signaling expansion. All indices are unmanaged. It is not possible to invest in an index. Past performance does not guarantee future results.
However, geopolitical risks could pose a threat to the trends that have been working in favor of small-cap investors. In times of uncertainty, it’s important to be confident in the companies we choose. Capital allocation decisions are insightful here. A good indicator of management’s conviction in their operational performance, strategic plan, and financial decision-making can come in the form of share buybacks, dividend increases and insider buying. Nearly 90% of the companies in our portfolio have active buybacks while 60% are currently boosting their dividend payouts and more than 1/3rd have seen insider buying. In all, 69% of our holdings are flashing at least two of these three important signs.
Another source of confidence comes from our adherence to our 10 Principles of Value Investing™. These guidelines require us to focus on fundamentals factors such valuations, balance sheet strength, earnings dynamics, and sound business strategies, among other considerations. Low prices, low debt, and high earnings growth potential help build in a margin of safety that is attractive to value investors like us but is particularly useful when uncertainty and volatility are on the rise.
The Value Plus Fund gained 4.95% in the first quarter, compared with the 4.96% gain for the Russell 2000® Value Index. Stock selection was neutral in the quarter with positive selection in Information Technology, Consumer Discretionary, and Health Care. By contrast, our selection effect was negative in Financials, Energy, and Real Estate.
The first quarter was a challenging period for artificial intelligence stocks, many of which stumbled as risk aversion returned to the market amid fears of a possible AI bubble forming. But for small-cap tech stocks, the first quarter proved to be quite strong in part because this group had already suffered setbacks last year and, for the most part, valuations never got out of hand.
An example is Silicon Motion Technology Corporation (SIMO). A year ago, shares of the leading maker of memory components used in PCs, smartphones, data centers, and industrial and auto applications sold off amid a variety of concerns. They included tariffs, consumer spending worries, and questions over whether investors might be overestimating the capex needs of large-scale cloud service providers known as hyperscalers. At the time, we remained committed to the stock because we believed the company was in the early days of a re-rating process, as SIMO had been making a push away from trailing-edge, lower-margin consumer electronics into higher-margin, leading-edge applications driven by hyperscaler demands.
What a difference a year makes. In the first quarter, the stock was a contributor to our outperformance, as consumer spending has held up and hyperscalers continue to indicate robust datacenter capex growth. In their fourth-quarter conference call, management reiterated the firm’s outlook for their PC and smartphone end markets and the growth prospects for their data center storage components, which are expected to drive margins substantially higher.
Yet in our opinion, SIMO remains meaningfully undervalued versus our current price target. The stock currently trades at $117, but we believe the company should be valued at $185. That’s based on a multiple of 15X EBITDA plus an anticipated $160 million cash settlement from SIMO’s ongoing arbitration with MaxLinear surrounding the termination of a proposed merger agreement more than two years ago.
In this K-shaped recovery, shares of Wyndham Hotels (WH) have been punished as revenues for hotels that operate in the midscale and economy space have lagged behind upscale peers such as Marriott or Hilton. This isn’t so surprising, as inflation has eaten into the consumer budgets while the weak manufacturing economy also impacted Wyndham’s grey and blue collar business travel base.
Yet a broadening economy and improving PMI should benefit Wyndham’s base of business travelers and middle income customers. The global franchisor of hotels such as Wyndham, Days Inn, Laquinta, Ramada, and Super 8 should also see an incremental boost in demand in some of its key markets thanks to key events this year, including the World Cup in North America, the 250th birthday celebration for the U.S., and the 100th anniversary of Route 66.
Wyndham shares are valued at just 11-12x EBITDA, which compares favorably to Marriott and Hilton, which trade at 17-20x EBITDA. Even better, management has been actively buying back the company’s shares while consistently boosting its dividend payout, hitting two of our three capital allocation priorities.
One of the biggest detractors to our strategy’s performance in the quarter was Stifel Financial Corp. (SF), which provides brokerage, investment banking, investment advisory, and related financial services.
Shares of the global wealth manager began selling off in early February as the market expressed concerns around AI’s ability to disrupt their business. Then, the spike in interest rates, driven by concerns about higher inflation and oil prices, further weighed on the stock as the market sold off in March, impacting total client assets and investment banking prospects during a period of potentially “higher for longer” rates.
We believe Stifel should still be able to grow revenues and expand margins for the foreseeable future as the company continues to execute on organic asset growth. The company ranked no. 1 in JD Power’s Advisor Satisfaction study for the third consecutive year. As a result, Stifel continues to attract new financial advisors to its platform. Meanwhile, AI should be a tailwind for operational efficiency as it allows Stifel to automate routine tasks like compliance checks, client onboarding, and producing reports. This should help boost advisor productivity and better client retention.
Yet with price/earnings ratio of 11 times 2026 consensus EPS estimates, we believe Stifel is trading at an attractive valuation, especially for a business enjoying durable low-double-digit EPS growth.
While recent geopolitical developments have introduced new uncertainties to the markets, investing is never certain. Our job as active managers is to focus on our security selection process. Our 10 Principles of Value Investing™ help guide us to underappreciated and overlooked stocks, many of which have already taken their lumps and trade at attractive levels. They also direct us to well-managed businesses with sound balance sheets and strategies, which build in an added margin of safety that will be particularly useful if volatility persists. If uncertainty wanes, though, we believe our bottom-up stock selection process should position us to take advantage of the broadening economy and improving market breadth.
Thank you for your continued trust and confidence in us.
Scroll over to view complete data
| Since Inception (%) | 20-Year (%) | 15-Year (%) | 10-Year (%) | 5-Year (%) | 3-Year (%) | 1-Year (%) | YTD* (%) | QTD* (%) | |
|---|---|---|---|---|---|---|---|---|---|
| Value Plus | 9.60 | 8.02 | 7.15 | 9.98 | 4.12 | 8.59 | 35.31 | 25.15 | 19.25 |
| Value Plus | 9.75 | 8.26 | 7.41 | 10.24 | 4.37 | 8.87 | 35.61 | 25.28 | 19.33 |
| Russell 2000® Value | 9.90 | 7.98 | 9.97 | 10.89 | 8.23 | 18.73 | 43.01 | 22.99 | 17.19 |
*Not annualized
Source: FactSet Research Systems Inc., Russell®, and Heartland Advisors, Inc.
The inception date for the Value Plus Fund is 10/26/1993 for the investor class and 5/1/2008 for the institutional class.
In the prospectus dated 5/1/2026, the Gross Fund Operating Expenses for the investor and institutional class of the Value Plus Fund are 1.22% and 0.99%, respectively. The Advisor has voluntarily agreed to waive fees and/or reimburse expenses with respect to the institutional class, to the extent necessary to maintain the institutional class’ “Net Annual Operating Expenses” at a ratio not to exceed 0.99% of average daily net assets. This voluntary waiver/reimbursement may be discontinued at any time. Without such waivers and/or reimbursements, total returns may have been lower.
Past performance does not guarantee future results. Performance represents past performance; current returns may be lower or higher. Performance for institutional class shares prior to their initial offering is based on the performance of investor class shares. The investment return and principal value will fluctuate so that an investor's shares, when redeemed, may be worth more or less than the original cost. All returns reflect reinvested dividends and capital gains distributions, but do not reflect the deduction of taxes that an investor would pay on distributions or redemptions. Subject to certain exceptions, shares of a Fund redeemed or exchanged within 10 days of purchase are subject to a 2% redemption fee. Performance does not reflect this fee, which if deducted would reduce an individual's return. To obtain performance through the most recent month end, call 800-432-7856 or visit heartlandadvisors.com.
©2026 Heartland Advisors | 790 N. Water Street, Suite 1200, Milwaukee, WI 53202 | Business Office: 414-347-7777 | Financial Professionals: 888-505-5180 | Individual Investors: 800-432-7856
In the prospectus dated 5/1/2026, the Gross Fund Operating Expenses for the investor and institutional class of the Value Plus Fund are 1.22% and 0.99%, respectively. The Advisor has voluntarily agreed to waive fees and/or reimburse expenses with respect to the institutional class, to the extent necessary to maintain the institutional class’ “Net Annual Operating Expenses” at a ratio not to exceed 0.99% of average daily net assets. This voluntary waiver/reimbursement may be discontinued at any time. Without such waivers and/or reimbursements, total returns may have been lower.
Past performance does not guarantee future results. Performance represents past performance; current returns may be lower or higher. Performance for institutional class shares prior to their initial offering is based on the performance of investor class shares. The investment return and principal value will fluctuate so that an investor's shares, when redeemed, may be worth more or less than the original cost. All returns reflect reinvested dividends and capital gains distributions, but do not reflect the deduction of taxes that an investor would pay on distributions or redemptions. Subject to certain exceptions, shares of a Fund redeemed or exchanged within 10 days of purchase are subject to a 2% redemption fee. Performance does not reflect this fee, which if deducted would reduce an individual's return. To obtain performance through the most recent month end, call 800-432-7856 or visit heartlandadvisors.com.
An investor should consider the Funds’ investment objectives, risks, and charges and expenses carefully before investing or sending money. This and other important information may be found in the Funds' prospectus. To obtain a prospectus, please call 800-432-7856 or visit heartlandadvisors.com. Please read the prospectus carefully before investing.
As of 3/31/2026, Silicon Motion Technology Corporation (SIMO), Stifel Financial Corporation (SF), and Wyndham Hotels (WH) represented 1.53%, 3.15% and 1.52% of the Value Plus Fund’s net assets, respectively.
Statements regarding securities are not recommendations to buy or sell.
Portfolio holdings are subject to change. Current and future holdings are subject to risk.
The Value Plus Fund invests in small companies that are generally less liquid and more volatile than large companies. The Fund also invests in a smaller number of stocks (generally 40 to 70) than the average mutual fund. The performance of these holdings generally will increase the volatility of the Fund’s returns.
Value investments are subject to the risk that their intrinsic value may not be recognized by the broad market.
The Value Plus Fund seeks long-term capital appreciation and modest current income.
The Fund’s performance information included in regulatory filings includes a required index that represents an overall securities market (Regulatory Benchmark). In addition, the Fund's regulatory filings may also include an index that more closely aligns to the Fund's investment strategy (Strategy Benchmark(s)). The Fund's performance included in marketing and advertising materials and information other than regulatory filings is generally compared only to the Strategy Benchmark.
The above individuals are registered representatives of ALPS Distributors, Inc.
The Heartland Funds are distributed by ALPS Distributors, Inc.
The statements and opinions expressed in this article are those of the presenter(s). Any discussion of investments and investment strategies represents the presenters’ views as of the date created and are subject to change without notice. The opinions expressed are for general information only and are not intended to provide specific advice or recommendations for any individual. The specific securities discussed, which are intended to illustrate the advisor’s investment style, do not represent all of the securities purchased, sold, or recommended by the advisor for client accounts, and the reader should not assume that an investment in these securities was or would be profitable in the future. Certain security valuations and forward estimates are based on Heartland Advisors’ calculations. Any forecasts may not prove to be true.
Economic predictions are based on estimates and are subject to change.
There is no guarantee that a particular investment strategy will be successful.
Sector and Industry classifications are sourced from GICS®.The Global Industry Classification Standard (GICS®) is the exclusive intellectual property of MSCI Inc. (MSCI) and S&P Global Market Intelligence (“S&P”). Neither MSCI, S&P, their affiliates, nor any of their third party providers (“GICS Parties”) makes any representations or warranties, express or implied, with respect to GICS or the results to be obtained by the use thereof, and expressly disclaim all warranties, including warranties of accuracy, completeness, merchantability and fitness for a particular purpose. The GICS Parties shall not have any liability for any direct, indirect, special, punitive, consequential or any other damages (including lost profits) even if notified of such damages.
Heartland Advisors defines market cap ranges by the following indices: micro-cap by the Russell Microcap®, small-cap by the Russell 2000®, mid-cap by the Russell Midcap®, large-cap by the Russell Top 200®.
Because of ongoing market volatility, performance may be subject to substantial short-term changes.
Dividends are not guaranteed and a company’s future ability to pay dividends may be limited. A company currently paying dividends may cease paying dividends at any time.
In certain cases, dividends and earnings are reinvested.
There is no assurance that dividend-paying stocks will mitigate volatility.
CFA® is a registered trademark owned by the CFA Institute.
Russell Investment Group is the source and owner of the trademarks, service marks and copyrights related to the Russell Indices. Russell® is a trademark of the Frank Russell Investment Group.
Artificial intelligence (AI) is intelligence perceiving, synthesizing, and inferring information demonstrated by computers, as opposed to intelligence displayed by humans or by other animals. Bottom-up is an investment approach that de-emphasizes the significance of economic and market cycles. This approach focuses on the analysis of individual stocks and the investor focuses his or her attention on a specific company rather than on the industry in which that company operates or on the economy as a whole. Buyback is the repurchase of outstanding shares (repurchase) by a company in order to reduce the number of shares on the market. Cyclical Stocks cover Basic Materials, Capital Goods, Communications, Consumer Cyclical, Energy, Financial, Technology, and Transportation which tend to react to a variety of market conditions that can send them up or down and often relate to business cycles. Earnings Before Interest, Taxes, Depreciation and Amortization (EBITDA) measures a company’s financial performance. It is used to analyze and compare profitability between companies and industries because it eliminates the effects of financing and accounting decisions. Enterprise Value (EV) is the entire economic value of a company. Insider Buying is the purchase of a company's stock by individual directors, executives or other employees. Margin of Safety is a principle of investing in which an investor only purchases securities when the market price is significantly below its intrinsic value. The ISM Purchasing Manager's Index (PMI) is a key economic indicator that gauges the health of the manufacturing sector in the United States, based on a monthly survey of purchasing and supply executives. ISM Manufacturing PMI (Purchasing Managers Index) is an index based on surveys of more than 400 manufacturing firms by the Institute for Supply Management (ISM). The PMI index is an indicator of the economic health of the manufacturing sector based on five major indicators: new orders, inventory levels, production, supplier deliveries and the employment environment. A reading over 50 represents that the industry is expanding, under 50 represents a contraction, while a reading at 50 represents no change. Russell Investment Group is the source and owner of the trademarks, service marks and copyrights related to the Russell Indices. Russell® is a trademark of the Russell Investment Group. Russell 2000® Index includes the 2000 firms from the Russell 3000® Index with the smallest market capitalizations. All indices are unmanaged. It is not possible to invest directly in an index. Russell 2000® Value Index measures the performance of those Russell 2000® companies with lower price/book ratios and lower forecasted growth characteristics. All indices are unmanaged. It is not possible to invest directly in an index. S&P 500 Index is an index of 500 U.S. stocks chosen for market size, liquidity and industry group representation and is a widely used U.S. equity benchmark. All indices are unmanaged. It is not possible to invest directly in an index. Selection Effect of the Attribution Analysis is the portion of the portfolio excess return attributable to choosing different securities within groups from the benchmark. 10 Principles of Value Investing™ consist of the following criteria for selecting securities: (1) catalyst for recognition; (2) low price in relation to earnings; (3) low price in relation to cash flow; (4) low price in relation to book value; (5) financial soundness; (6) positive earnings dynamics; (7) sound business strategy; (8) capable management and insider ownership; (9) value of company; and (10) positive technical analysis.
Data sourced from FactSet: Copyright 2026 FactSet Research Systems Inc., FactSet Fundamentals. All rights reserved.
Heartland’s investing glossary provides definitions for several terms used on this page.


