"Men, it has been well said, think in herds; it will be seen that they go mad in herds, while they only recover their senses slowly, and one by one.”
— Charles Mackay
In a year in which trillions of dollars have poured into giant tech stocks in search of AI’s promise, scores of well-run, already profitable, and attractively priced businesses have been begging for attention. Yet we are confident the mega-cap momentum party won’t last forever and encouraged by the fact that interest in small value is building as the market is broadening out.
In the fourth quarter, the Russell 2000® Value Index returned 3.26%, outpacing the 2.66% gains for the S&P 500. As a result of the year-end rally, small stocks nearly pulled even with large caps in 2025, marking their best relative performance since the pandemic.
Part of this is due to strengthening fundamentals and earnings. Profit growth for small companies is on track to surpass that of large caps for the first time in 13 quarters. We believe this trend is likely to continue as the Federal Reserve lowers interest rates and as the regulatory backdrop improves — both factors that have historically benefited emerging businesses more than giant multinationals. In 2025, the total cost of regulations, as a percentage of GDP, fell by 0.24% after climbing consistently over the past two decades, according to data compiled by the American Action Forum.
Another factor contributing to the broadening market is valuations. There are signs that investors are finally beginning to appreciate how attractively priced small stocks are. In the past quarter, for example, four of our Strategy’s holdings were taken private, raising our take-out total to 14 over the past year.
However, just 10% of companies account for more than 75% of the market’s overall capitalization, so concentration is likely to persist (see the chart below). But this reminds us of the observations of the 19th century Scottish writer Charles Mackey, who studied cultural fads and investment bubbles. Mackey observed that while crowds coalesce quickly, the unwinding of manias tends to take place more sporadically and gradually as individuals “recover their senses slowly and one by one.” This is why we believe we’re still in the first or second inning of the small-cap rebound.
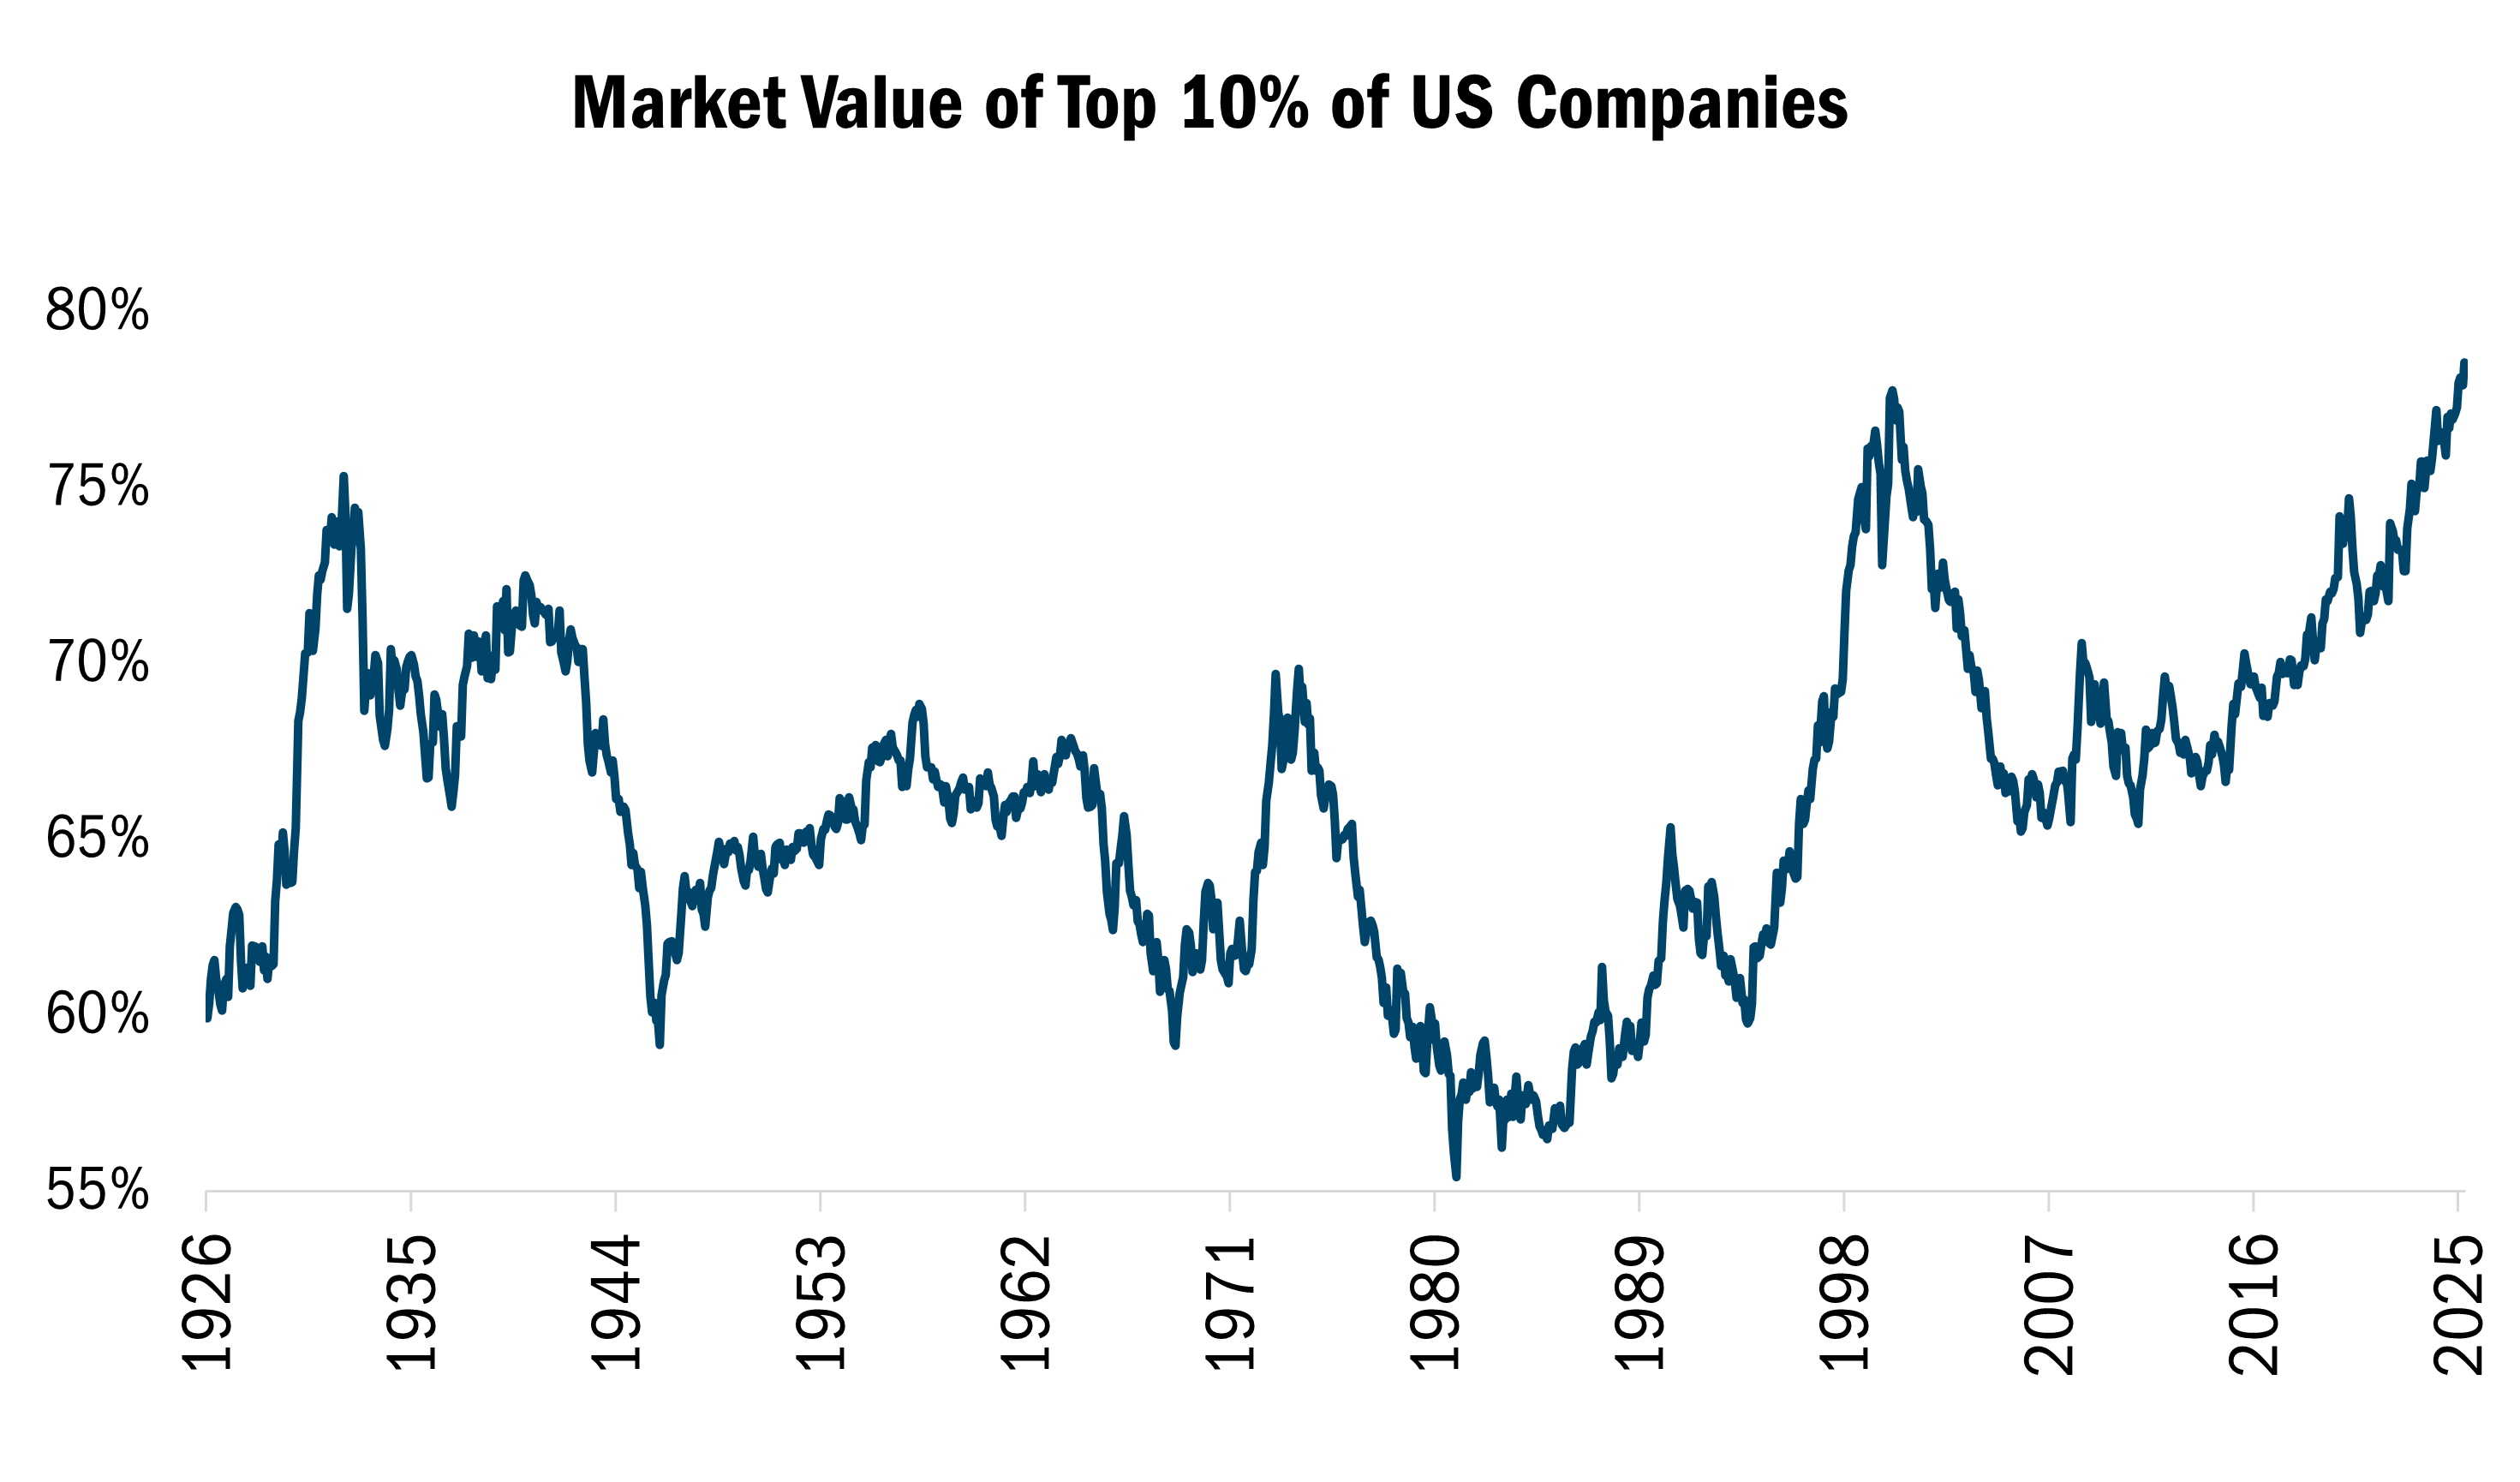
Source: Kenneth R. French Data Library at Dartmouth via Allied Investment Advisors, Monthly data from 7/1/1926 to 10/1/2025. This chart represents the Market Value of Top 10% of US Companies through Kenneth R. French U.S. Research Returns Data. Kenneth R. French's U.S. Research Returns Data is a comprehensive dataset that captures the performance of U.S. stocks over time. All indices are unmanaged. It is not possible to invest directly in an index. Past performance does not guarantee future results.
Despite the promising opportunity set, it’s important for investors not to get ahead of themselves. At Heartland, our 10 Principles of Value Investing™ require us to make portfolio decisions based on rigorous fundamental factors. This focus on low valuations, high-quality balance sheets, financial soundness, and positive earnings dynamics, among other attributes, has served us and our clients well for more than 41 years. Our process goes beyond this 10-point system, as we also monitor our exposures across sectors, industries, factors, and other risk considerations. By doing so, we aim to capitalize on dislocations in the market.
In the fourth quarter, the Heartland Small Cap Value Strategy gained 2.98%, compared with the 3.26% return for the Russell 2000® Value Index. While the Strategy slightly underperformed its benchmark in the quarter, it has outpaced the index over the past one, three, five, and 10 years.
During the quarter, stock selection was positive despite slightly underperforming the Index. Health Care accounted for nearly all the negative impact. Our results were more the outcome of what we didn’t own than our actual holdings in the sector. Biotech companies in the benchmark soared in October and November, which is a good example of the speculation which persists. However, we don’t have direct exposure to this group, as many are profitless. We are, though, actively examining our Health Care stocks as several were among our portfolio’s biggest detractors in the quarter.
An example of a Health Care holding that struggled in the quarter was Integer Holdings Corporation (ITGR), which specializes in the design, development, and production of medical technologies and components. In late October, Integer’s stock sank more than 30% after the company significantly lowered its outlook for growth and margin expansion in 2026, as several products experienced slower market adoption than was expected. But management expects these headwinds to be short-lived, with a robust portfolio of higher growth and margin products coming to market, which should allow the company to get back on track. The company still expects to outgrow its industry peers by 2% while growing earnings before interest and taxes (EBIT) at twice the rate of sales.
Even better, the company announced a $200 million stock repurchase authorization after the selloff, increasing our conviction that the shares are materially undervalued. This confidence drove us to increase our exposure to Integer in the quarter.
Another position we increased earlier in the quarter was Columbus McKinnon (CMCO), which designs, manufactures, and distributes materials, handling products, and systems used in a variety of industrial applications, including lifting, automation, and precision conveyance. Early this year, CMCO reported slower-than-expected Q3 results, citing slowing industry demand driven by U.S. policy uncertainty. By itself, that would have likely triggered a mid-single-digit to high-single-digit selloff based on historic price reactions. However, management also announced a $2.7 billion acquisition of a competitor, Kito Crosby, which sent the stock plummeting more than 40% due to concerns surrounding execution and an increased leverage profile upon closing.
At current prices, we believe Columbus has a compelling risk/reward profile as management seeks to reduce leverage and improve the growth and margin profile of the consolidated business. Management is targeting mid-20% EBITDA margins upon integration, up from 15.5% in FY25 pre-acquisition.
In our opinion, CMCO can rerate closer to its industrial peers that trade at an average of 12x EV/EBITDA. Meanwhile, our view of the stock’s attractive valuations seems to be validated by aggressive insider buying by management in the aftermath of the Q3 selloff.
Due to robots, quants and momentum players dominating trading, it is not unusual for holdings to experience 10%, 20%, or even more, intraday swings in price. As active, fundamental investors we endeavor to take advantage of outsized moves –up or down-if our research indicates over reaction.
To amplify here is a recent vivid example of one of your holdings:
SunOpta (STKL), the leader in plant-based milk production, was a significant detractor during the quarter. Sales posted another record, Q3 +17%, and by our estimates reaching $815 million in ’25 with profitability. However, the company, which supplies leading retailers including Starbucks, Walmart, Costco, and others, sold off after resetting earnings expectations for 2026, though management raised their sales outlook.
The lower guidance was caused by a few key customers accelerating supply decisions, straining STKL’s operations and capacity and increasing maintenance costs. We believe this is a classic case of the market overreacting to short-term news. In reality, the additional volume demand is a positive for SunOpta, as not many companies in the Consumer Staples sector are seeing enough growth to worry about production constraints. The day of the release, November 5, STKL was trading at $5.26. On the news, the stock gapped down to $3.86- a drop of 30%. Our research identified this as an overreaction, so we added to our position.
Over the next 12 months, we expect these temporary margin headwinds will subside as STKL adds a new manufacturing line that is already 50% subscribed and installs new equipment to increase wastewater capacity at the facility. SunOpta enjoys a key advantage over its peers as it is the only manufacturer in its categories with a nationwide footprint. The company is also benefitting from increased adoption of oat milk and other dairy alternatives, as many large coffee chains have dropped extra charges for plant-based milks and increased the number of menu items utilizing them. This includes Starbucks, which is its largest customer.
After the sell-off, SunOpta shares are trading at 8.2 times EBITDA, an attractive price for a leading Consumer Staples company operating in growing categories. We are also heartened to see insiders, including the CFO, Directors, and others buying shares. This is part of our 10 Principles, which has been refined since the bear market of 1970-1973.
One by one, investors seem to be recovering their senses, to borrow a phrase from Charles Mackay. This is bringing renewed attention to small stocks, which have been overlooked, undervalued, under-followed and under-owned for some time. This gives us hope, as does improving market breadth, which should be positive not just for Heartland’s process but for active management in general.
We believe successful active managers have to pair promising opportunities with a disciplined approach, to be mindful not only of the risk/reward proposition of individual securities but of their overall portfolio. At Heartland, this bottom-up focus on the fundamentals, coupled with a top-to-bottom assessment of our portfolio, has served our clients well for more than four decades. We suspect it’s also going to come in very handy in the years ahead.
Fundamentally yours,
The Heartland Investment Team
Scroll over to view complete data
| Since Inception (%) | 10-Year (%) | 5-Year (%) | 3-Year (%) | 1-Year (%) | YTD (%) | QTD (%) | |
|---|---|---|---|---|---|---|---|
| Small Cap Value Composite (Net of Advisory Fees)** | 11.33 | 9.87 | 13.03 | 20.42 | 28.44 | 28.44 | 3.03 |
| Small Cap Value Composite (Net of Bundled Fees) | 9.91 | 9.55 | 12.71 | 20.10 | 28.12 | 28.12 | 2.98 |
| Russell 2000® Value | 10.02 | 9.27 | 8.88 | 11.73 | 12.59 | 12.59 | 3.26 |
Source: FactSet Research Systems Inc., Russell Investment Group, and Heartland Advisors, Inc.
*Yearly and quarterly returns are not annualized. The Strategy's inception date is 10/1/1988.
**Shown as supplemental information.
The US Dollar is the currency used to express performance. Returns are presented net of advisory fees and net of bundled fees and include the reinvestment of all income. The returns net of bundled fees were calculated by subtracting the highest applicable sponsor portion of the separately managed wrap account fee from the net of advisor fees return.
©2026 Heartland Advisors | 790 N. Water Street, Suite 1200, Milwaukee, WI 53202 | Business Office: 414-347-7777 | Financial Professionals: 888-505-5180 | Individual Investors: 800-432-7856
Past performance does not guarantee future results.
The Small Cap Value Strategy seeks long-term capital appreciation by investing in micro- and small-cap companies, generally with market capitalizations of less than the largest companies in the Russell 2000 Value Index, at the time of purchase. The micro- and small-cap segment of the stock market is robust with thousands of publicly traded issues, many of which lack traditional Wall Street research coverage. Thus, we believe this market is often inefficient, mispricing businesses and offering opportunities for fundamental research-minded investors such as Heartland.
The Small Cap Value Strategy invests in small companies selected on a value basis. Such securities generally are more volatile and less liquid than those of larger companies.
Value investments are subject to the risk that their intrinsic values may not be recognized by the broader market.
Heartland Advisors, Inc. (the “Firm”) claims compliance with the Global Investment Performance Standards (GIPS®). The Firm is a wholly owned subsidiary of Heartland Holdings, Inc. and is registered with the Securities and Exchange Commission. For a complete list and description of Heartland Advisors composites and/or a presentation that adheres to the GIPS® standards, contact Institutional Sales at Heartland Advisors, Inc. at the address listed below.
As of 12/31/2025, Heartland Advisors, Inc. on behalf of its clients held approximately represented 2.07%, 0.69%, and 1.78% of the total shares outstanding of Columbus McKinnon Corporation (CMCO), Integer Holdings Corporation (ITGR), and SunOpta Inc. (STKL) respectively.
The future performance of any specific investment or strategy (including the investments discussed above) should not be assumed to be profitable or equal to past results. The performance of the holdings discussed above may have been the result of unique market circumstances that are no longer relevant. The holdings identified above do not represent all of the securities purchased, sold or recommended for the Advisor’s clients.
Portfolio holdings are subject to change. Current and future portfolio holdings are subject to risk.
Statements regarding securities are not recommendations to buy or sell.
In certain cases, dividends and earnings are reinvested.
GIPS® is a registered trademark of CFA Institute. CFA Institute does not endorse or promote this organization, nor does it warrant the accuracy or quality of the content contained herein.
Separately managed accounts and related investment advisory services are provided by Heartland Advisors, Inc., a federally registered investment advisor. ALPS Distributors, Inc., is not affiliated with Heartland Advisors, Inc.
The statements and opinions expressed in this article are those of the presenter(s). Any discussion of investments and investment strategies represents the presenters’ views as of the date created and are subject to change without notice. The opinions expressed are for general information only and are not intended to provide specific advice or recommendations for any individual. The specific securities discussed, which are intended to illustrate the advisor’s investment style, do not represent all of the securities purchased, sold, or recommended by the advisor for client accounts, and the reader should not assume that an investment in these securities was or would be profitable in the future. Certain security valuations and forward estimates are based on Heartland Advisors’ calculations. Any forecasts may not prove to be true.
Economic predictions are based on estimates and are subject to change.
There is no guarantee that a particular investment strategy will be successful.
Sector and Industry classifications are sourced from GICS®.The Global Industry Classification Standard (GICS®) is the exclusive intellectual property of MSCI Inc. (MSCI) and S&P Global Market Intelligence (“S&P”). Neither MSCI, S&P, their affiliates, nor any of their third party providers (“GICS Parties”) makes any representations or warranties, express or implied, with respect to GICS or the results to be obtained by the use thereof, and expressly disclaim all warranties, including warranties of accuracy, completeness, merchantability and fitness for a particular purpose. The GICS Parties shall not have any liability for any direct, indirect, special, punitive, consequential or any other damages (including lost profits) even if notified of such damages.
Heartland Advisors defines market cap ranges by the following indices: micro-cap by the Russell Microcap®, small-cap by the Russell 2000®, mid-cap by the Russell Midcap®, large-cap by the Russell Top 200®.
Because of ongoing market volatility, performance may be subject to substantial short-term changes.
Dividends are not guaranteed and a company’s future ability to pay dividends may be limited. A company currently paying dividends may cease paying dividends at any time.
There is no assurance that dividend-paying stocks will mitigate volatility.
Russell Investment Group is the source and owner of the trademarks, service marks and copyrights related to the Russell Indices. Russell® is a trademark of the Frank Russell Investment Group.
Data sourced from FactSet: Copyright 2026 FactSet Research Systems Inc., FactSet Fundamentals. All rights reserved.
Heartland’s investing glossary provides definitions for several terms used on this page.
Active Management is the use of a human element, such as a single manager, co-managers or a team of managers, to actively manage a fund's portfolio. Active managers rely on analytical research, forecasts, and their own judgment and experience in making investment decisions on what securities to buy, hold and sell. Artificial intelligence (AI) is intelligence—perceiving, synthesizing, and inferring information—demonstrated by computers, as opposed to intelligence displayed by humans or by other animals. Earnings Before Interest, Taxes, Depreciation and Amortization (EBITDA) measures a company’s financial performance. It is used to analyze and compare profitability between companies and industries because it eliminates the effects of financing and accounting decisions. Earnings Before Interest and Tax (EBIT) is an indicator of a company’s profitability, calculated as revenue minus expenses, excluding tax and interest to eliminate the effect of different capital structures and tax rates used by different companies. Enterprise Value/Earnings Before Interest, Taxes, Depreciation, and Amortization (EV/EBITDA) Ratio is a financial indicator used to determine the value of a company and is calculated by dividing the entire economic value of the company (enterprise value) by its earnings before interest, taxes, depreciation, and amortization (EBITDA). Free Cash Flow is the amount of cash a company has after expenses, debt service, capital expenditures, and dividends. The higher the free cash flow, the stronger the company’s balance sheet. Insider Buying is the purchase of a company's stock by individual directors, executives or other employees. Russell Investment Group is the source and owner of the trademarks, service marks and copyrights related to the Russell Indices. Russell® is a trademark of the Russell Investment Group. Momentum is the rate of acceleration of a security's price or trade volume. Russell 2000® Value Index measures the performance of those Russell 2000® companies with lower price/book ratios and lower forecasted growth characteristics. S&P 500 Index is an index of 500 U.S. stocks chosen for market size, liquidity and industry group representation and is a widely used U.S. equity benchmark. All indices are unmanaged. It is not possible to invest directly in an index. S&P 500 Value Index measures value stocks using three factors: the ratios of book value, earnings, and sales to price. S&P Style Indices divide the complete market capitalization of each parent index into growth and value segments. Constituents are drawn from the S&P 500. 10 Principles of Value Investing™ consist of the following criteria for selecting securities: (1) catalyst for recognition; (2) low price in relation to earnings; (3) low price in relation to cash flow; (4) low price in relation to book value; (5) financial soundness; (6) positive earnings dynamics; (7) sound business strategy; (8) capable management and insider ownership; (9) value of company; and (10) positive technical analysis.


