Heartland Advisors

Heartland Opportunistic Value Equity Strategy 4Q23 Portfolio Manager Commentary

Executive Summary

  • The market rebounded sharply at the end of October, as hopes for a Goldilocks economic scenario crystallized.  
  • Market breadth broadened in the fourth quarter, but the sharpest gains have been concentrated in more speculative parts of the market, which we believe requires discipline and patience.
  • Though the Strategy trailed its benchmark in the quarter, we outperformed for the year thanks largely to stock selection.   

Fourth Quarter Market Discussion

The market’s mood ending 2023 was a mirror image of 2022, as hopes for a Goldilocks economic scenario, where inflation continues to moderate while the economy keeps growing, picked up steam. After losing ground in the summer months, the Russell 3000® Index surged more than 12% in the final three months of the year.

The Federal Reserve appeared to lend some credence to the “soft landing” narrative, especially after November data showed that the Consumer Price Index rose at only a slightly faster annual pace than in March 2021, during the COVID-19 shutdowns. With the Federal Open Market Committee signaling the likelihood of three interest rate cuts to come in 2024—and the futures market counting on six —investors flocked to parts of the market that stand to benefit early in an economic cycle, such as Financials, Consumer Discretionary, and Industrials. Meanwhile, those investors who started the year cautiously positioned were motivated to join the fray by bidding up early-cycle (and in many cases, highly leveraged) stocks late in the quarter. 

It should be noted, however, that monetary policy tends to act with a lag. So, while the economy remains surprisingly resilient after nearly two years of interest rate hikes, the full effects of those higher rates may not have worked their way into the data yet. 

For example, today’s 3.7% unemployment remains near historic lows, but small business new hiring plans have fallen to where they stood in February 2021, in the midst of the global pandemic, according to the National Federation of Independent Business. At the same time, four out of ten companies expect layoffs in 2024 and five out of ten are planning hiring freezes, according to a survey by the job search site ResumeBuilder.com. 

Mix in the fact that credit card delinquency and charge-off rates are now above their pre-pandemic levels—indicating that households have depleted their excess stimulus savings (see chart below)—and this paints a picture that isn’t as pretty as the consensus narrative would imply.

Consumer Confidence Index v. Real GDP Growth

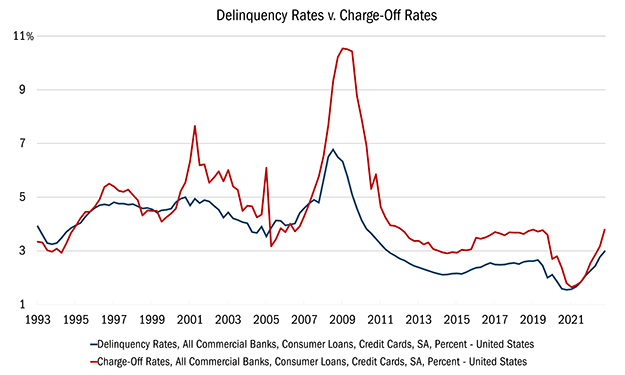
Source: FactSet Research Systems Inc., Quarterly data from 12/31/1993 to 09/29/2023. This chart represents Delinquency Rates compared to Charge-Off Rates in the United States. The delinquency rate is the amount of debt that is past due. Charge-off is a debt deemed uncollectible by the reporting firm. It is written off and removed from the firm's balance sheet. All indices are unmanaged. It is not possible to invest directly in an index. Past performance does not guarantee future results.

The fourth quarter was really a tale of two markets. From the end of September through October 27, the broad markets slumped, with large-caps losing slightly less than mid-caps, which sank a bit less than small. Since the Goldilocks scenario crystallized in late October, however, the Russell 2000® Index of small stocks is up 24.3% versus 20.5% for the Russell Midcap® Index and 16.2% for the S&P 500® Index of large stocks. 

Small caps, in particular, have been performing better, especially after the deadline for mutual fund tax loss harvesting passed at the end of October. This could be an initial sign that what had been a historically narrow market, led by the so-called Magnificent 7 mega-cap stocks, is finally broadening. We continue to see opportunities down market cap. However, after the furious market rally since the end of October, the margin of safety has narrowed. 

To be clear, our view of the economy is as valuable as any economic pundit, that is, it’s worthless. There was a lot to worry about entering 2023 including the war in Ukraine, high inflation, rising interest rates, etc., yet equities soared. 2023 should serve as a reminder that timing the market is a fool’s errand. We don’t know what the future holds for the economy or for stocks in the short run, but we do know the margin of safety in equities has narrowed significantly relative to one year ago and discipline is extraordinarily important. We believe that owning undervalued equities is a better way to compound wealth over the long term than holding cash or owning bonds.

Attribution Analysis

The Strategy gained 7.6% in the quarter, trailing the Russell 3000® Value Index, which posted returns of 9.8%. For the year, however, the Strategy outperformed the benchmark, gaining 13.1% in 2023 versus 11.7% for the Index, thanks almost entirely to stock selection. 

The largest stocks in our portfolio (representing the top 10% by market capitalization) gained 4% during the quarter, while the smallest stocks returned 23%. As a result of that small-cap outperformance, the Strategy’s weighting shifted slightly from 31% small-cap/33% mid-cap/34% large-cap at the start of the quarter to 33% small/34% mid/30% large at the end. 

Portfolio Activity

Our allocations to small-, mid-, and large-caps are not a top-down call. We let our bottoms-up stock selection organically dictate our weightings, and that focus on security selection is showcased in the following names:    

Consumer Staples. A new position initiated in the quarter, Dollar General (DG), is an example of a business that offers visibility through an entire cycle. 

DG operates more than 19,000 stores across the U.S., 80% of which are in towns with a population of less than 20,000. This rural focus results in core customers with incomes averaging around $35,000 a year. These customers rely on Dollar General to provide affordable products close to where they live. Roughly 75% of all goods sold by DG are daily necessities such as food, toiletries, and cleaning supplies, which limits demand cyclicality. 

Yet operations haven’t been running smoothly over the past two years. DG grew rapidly over the years, including adding more than 900 new stores per year over the past 5 years. This growth was manageable until the pandemic struck and customer buying patterns changed while supply chain bottlenecks created major operational challenges. Strong consumer spending in 2020 and 2021, driven by stimulus funds, influenced management to order more discretionary inventory to support extended shipment lead times. 

By 2023, however, excess stimulus savings were consumed, and spending patterns and supply chains began to normalize. DG found itself with too much discretionary inventory at warehouses, spotty in-store inventory, and a weakening consumer. Meanwhile, the purchasing power of DG’s core customer weakened due to inflationary pressures. As a result, same-store sales turned negative year over year in the second quarter. Operating margins also fell to an estimated 6.5% in fiscal year 2023, down from more than 10% in 2020, and the stock lost more than 57% of its value in the first nine months of the year. 

But management is getting back to basics by improving in-store inventory availability, rationalizing discretionary inventory, and reducing consumable prices to help their core customer. To reduce supply-chain complexity, management is also reducing less-productive SKUs with the goal of improving margins and asset utilization. Discretionary inventory should be fully rationalized moving into 2024, and we expect DG’s same-store sales comparisons to improve with customer purchasing activity focused on essential products, where there is little downside.

The stock now trades at 17 times earnings expectations over the next 12 months, which is slightly above its median since-Initial Public Offering (IPO) multiple of 16.5x. We believe DG is underearning after the margin pressures experienced over the past two years. The company could earn more than $10 per share at an 8% EBIT margin, which would imply a multiple of less than 13 based on normalized earnings power.

Financials. We bought Glacier Bancorp (GBCI) when the markets were stressed about the health of regional banks. With assets of around $28 billion, Glacier is leveraging its dominant position in Montana, where it enjoys 20% deposit market share, to consolidate the Mountain West. Glacier has acquired 15 banks over the past decade and currently operates 17 divisions across the region, encompassing Montana, Idaho, Washington, Wyoming, Nevada, Utah, Colorado, and Arizona. 

From the start of December 2022 through mid-May 2023, the stock lost more than half its value as it was caught up in the funding crisis that gripped regional banks. The overhang was exacerbated after GBCI’s management elected to tap the Federal Reserve Bank Term Lending Facility (BTLF), which allows banks to pledge government securities trading at a discount to par for par proceeds. 

We believe GBCI’s management utilized the BTLF opportunistically, not out of necessity, because facility interest rates were abnormally low due to the negative connotation associated with borrowing from the Federal Reserve. Also, the common trait shared by banks that failed in 2023 was a low-quality deposit base characterized by high concentration risk. For example, Silicon Valley Bank (SVB) bet on start-ups backed by venture capital (VC), with an average deposit that was several million dollars in size. When VC investors suggested pulling funds from SVB, a classic “run on the bank” ensued. By contract, the average Glacier retail customer has $16,000 in their account and the typical commercial account is less than $75,000. Customers largely use their GBCI account to pay for day-to-day expenses, not to earn a return, thereby reducing the risk of mass deposit outflows.

The market is finally recognizing this distinction, as the stock rebounded nearly 45% in the fourth quarter. Even after its late 2023 surge, GBCI trades at 2.5 times tangible book value, which is still below its 20-year median of 2.6, and with the recent decline in interest rates, book value growth should accelerate.  

Communications. A year ago, we took advantage of market volatility to upgrade our portfolio with best-in-class holdings including Cable One (CABO), a broadband and cable provider with a focus on rural markets in the Midwest, Northwest, and Southeast.

In theory, the stock should have rallied in the fourth quarter as long-term interest rates began to fall. But 2023 turned out to be a challenging year for broadband providers, including CABO, whose shares are down more than 15% since mid-October. 

Thanks to rising interest rates between January and late October, the number of families moving fell to a multi-year low, as existing home sales sank to 2010 levels. This is an important metric for broadband services since every move creates an opportunity for companies like CABO to win new customers. The fact that mortgage rates have fallen from 8% at the start of November to approximately 7% today provides some relief but borrowing costs have not fallen enough to trigger a recovery in moves.  

This lack of new customer acquisitions has exacerbated concerns about rising competition from alternative modes of internet, mainly fiber-to-the-home (FTTH) and fixed-wireless access (FWA). While we believe CABO is relatively well insulated from this competitive pressure, the lack of new customer additions is fueling the current overhang.  

Management is reacting to the soft environment by testing new lower price offerings capable of attracting a new customer base. Longer term, moving activity should rebound, resulting in better customer acquisition opportunities. Meanwhile, the stock trades at 7.2 times Enterprise Value to EBITDA, which compares favorably to its median post-spinoff multiple of 11.1 and the 11.0 multiple for the Russell 3000® Value Index. 

Outlook and Positioning

We continue to take a balanced view of this market knowing that uncertainty remains high and predicting the future is impossible. As always, we will start by assessing downside risk associated with any investment and invest your capital only when we believe the risk is being adequately compensated.

Though market leadership appears to be expanding, the small-cap rally thus far has been concentrated in more speculative parts of the market, which is not where we focus. We want to own high-quality companies that are conservatively financed and trade at a discount to their intrinsic value. These businesses haven’t been the drivers of this post-October rebound, but they did help us outperform our benchmark for the full year. That’s why it’s so important to remain patient and stay true to our 10 Principles of Value Investing™, which require us to look for well-managed, financially strong businesses that can grow cash flow and value over time.

Please wait while we gather your results.

Portfolio Management Team

Heartland Advisors Value Investing Portfolio Manager Troy McGlone

Troy McGlone

Vice President and Portfolio Manager

Heartland Advisors Value Investing Portfolio Manager Colin McWey

Colin McWey

Vice President and Portfolio Manager

Composite Returns*

Scroll over to view complete data

Source: FactSet Research Systems Inc., Russell Investment Group, and Heartland Advisors, Inc.
*Yearly and quarterly returns are not annualized. The Strategy's inception date is 9/30/1999. 
**Shown as supplemental information. 

The US Dollar is the currency used to express performance. Returns are presented net of advisory fees and net of bundled fees and include the reinvestment of all income. The returns net of bundled fees were calculated by subtracting the highest applicable sponsor portion of the separately managed wrap account fee from the net of advisor fees return.

Opportunistic Value Equity Strategy Quick Links

Factsheet


Download PDF

Commentary


View Commentary

Attribution & Contribution Reports

Sign In

Holdings


Sign In


Email Sign Up


©2024 Heartland Advisors | 790 N. Water Street, Suite 1200, Milwaukee, WI 53202 | Business Office: 414-347-7777 | Financial Professionals: 888-505-5180 | Individual Investors: 800-432-7856

Past performance does not guarantee future results.

The Opportunistic Value Equity Strategy seeks to capture long-term capital appreciation by investing in companies with market capitalizations greater than $500 million. The Strategy’s flexible pursuit of value positions it as a core holding for investors.
 

In addition to stocks of large companies, the Opportunistic Value Equity Strategy invests in stocks of small- and mid-cap companies that are generally less liquid than large companies. The performance of these holdings generally will increase the volatility of the strategy’s returns.

Value investments are subject to the risk that their intrinsic value may not be recognized by the broad market.

Heartland Advisors, Inc. (the "Firm") claims compliance with the Global Investment Performance Standards (GIPS®). The Firm is a wholly owned subsidiary of Heartland Holdings, Inc., and is registered with the Securities and Exchange Commission. For a complete list and description of Heartland Advisors composites and/or a presentation that adheres to the GIPS® standards, contact the Institutional Sales Team at Heartland Advisors, Inc. at the address listed below.

As of 12/31/2023,  Cable One, Inc. (CABO), Dollar General Corp. (DG), and Glacier Bancorp, Inc. (GBCI), represented 0.81%, 0.93%, and 2.42% of the Opportunistic Value Equity Composite’s net assets, respectively.

The future performance of any specific investment or strategy (including the investments discussed above) should not be assumed to be profitable or equal to past results. The performance of the holdings discussed above may have been the result of unique market circumstances that are no longer relevant. The holdings identified above do not represent all of the securities purchased, sold or recommended for the Advisor’s clients.

Statements regarding securities are not recommendations to buy or sell. 

Portfolio holdings are subject to change. Current and future portfolio holdings are subject to risk.

GIPS® is a registered trademark of CFA Institute. CFA Institute does not endorse or promote this organization, nor does it warrant the accuracy or quality of the content contained herein.

Separately managed accounts and related investment advisory services are provided by Heartland Advisors, Inc., a federally registered investment advisor. ALPS Distributors, Inc., is not affiliated with Heartland Advisors, Inc.

The statements and opinions expressed in this article are those of the presenter(s). Any discussion of investments and investment strategies represents the presenters’ views as of the date created and are subject to change without notice. The opinions expressed are for general information only and are not intended to provide specific advice or recommendations for any individual. The specific securities discussed, which are intended to illustrate the advisor’s investment style, do not represent all of the securities purchased, sold, or recommended by the advisor for client accounts, and the reader should not assume that an investment in these securities was or would be profitable in the future. Certain security valuations and forward estimates are based on Heartland Advisors’ calculations. Any forecasts may not prove to be true. 

Economic predictions are based on estimates and are subject to change.

There is no guarantee that a particular investment strategy will be successful.

Sector and Industry classifications are sourced from GICS®.The Global Industry Classification Standard (GICS®) is the exclusive intellectual property of MSCI Inc. (MSCI) and S&P Global Market Intelligence (“S&P”).  Neither MSCI, S&P, their affiliates, nor any of their third party providers (“GICS Parties”) makes any representations or warranties, express or implied, with respect to GICS or the results to be obtained by the use thereof, and expressly disclaim all warranties, including warranties of accuracy, completeness, merchantability and fitness for a particular purpose.  The GICS Parties shall not have any liability for any direct, indirect, special, punitive, consequential or any other damages (including lost profits) even if notified of such damages.

Heartland Advisors defines market cap ranges by the following indices: micro-cap by the Russell Microcap®, small-cap by the Russell 2000®, mid-cap by the Russell Midcap®, large-cap by the Russell Top 200®.

Because of ongoing market volatility, performance may be subject to substantial short-term changes.

Dividends are not guaranteed and a company’s future ability to pay dividends may be limited. A company currently paying dividends may cease paying dividends at any time.

In certain cases, dividends and earnings are reinvested.

There is no assurance that dividend-paying stocks will mitigate volatility.

CFA® is a registered trademark owned by the CFA Institute.

Russell Investment Group is the source and owner of the trademarks, service marks and copyrights related to the Russell Indices. Russell® is a trademark of the Frank Russell Investment Group.

Data sourced from FactSet: Copyright 2024 FactSet Research Systems Inc., FactSet Fundamentals. All rights reserved.

Heartland’s investing glossary provides definitions for several terms used on this page.

Bottom-up is an investment approach that de-emphasizes the significance of economic and market cycles. This approach focuses on the analysis of individual stocks and the investor focuses his or her attention on a specific company rather than on the industry in which that company operates or on the economy as a whole. Book Value is the sum of all of a company’s assets, minus its liabilities. Charge-off is a debt deemed uncollectible by the reporting firm. It is written off and removed from the firm's balance sheet. Consumer Price Index (CPI) is the most widely used measure of consumer price inflation. The CPI measures the average change over time in the prices paid by urban consumers for goods and services. The Bureau of Labor Statistics (BLS) of the U.S. Department of Labor collects the CPI price information and calculates the CPI statistics. Earnings Before Interest and Tax (EBIT) is an indicator of a company’s profitability, calculated as revenue minus expenses, excluding tax and interest to eliminate the effect of different capital structures and tax rates used by different companies. Enterprise Value/Earnings Before Interest, Taxes, Depreciation, and Amortization (EV/EBITDA) Ratio is a financial indicator used to determine the value of a company and is calculated by dividing the entire economic value of the company (enterprise value) by its earnings before interest, taxes, depreciation, and amortization (EBITDA). Federal Open Market Committee (FOMC) is the branch of the Federal Reserve Board that determines the direction of monetary policy. The FOMC is composed of the board of governors, which has seven members, and five reserve bank presidents. Intrinsic Value is the actual value of a company or an asset based on an underlying perception of its true value including all aspects of the business, in terms of both tangible and intangible factors. This value may or may not be the same as the current market value. Margin of Safety is a principle of investing in which an investor only purchases securities when the market price is significantly below its intrinsic value. Russell Investment Group is the source and owner of the trademarks, service marks and copyrights related to the Russell Indices. Russell® is a trademark of the Russell Investment Group. Russell Midcap® Index measures the performance of the 800 smallest companies in the Russell 1000® Index. All indices are unmanaged. It is not possible to invest directly in an index. Russell 2000® Index includes the 2000 firms from the Russell 3000® Index with the smallest market capitalizations. All indices are unmanaged. It is not possible to invest directly in an index. Russell 3000® Index is a market capitalization weighted equity index maintained by the Russell Investment Group that seeks to be a benchmark of the entire U.S. stock market and encompasses the 3,000 largest U.S.-traded stocks, in which the underlying companies are all incorporated in the U.S. All indices are unmanaged. It is not possible to invest directly in an index. Russell 3000® Value Index measures the performance of those Russell 3000® Index companies with lower price/book ratios and lower forecasted growth characteristics. All indices are unmanaged. It is not possible to invest directly in an index. S&P 500 Index is an index of 500 U.S. stocks chosen for market size, liquidity and industry group representation and is a widely used U.S. equity benchmark. All indices are unmanaged. It is not possible to invest directly in an index. Tangible Book Value is the sum of all of a company’s assets, minus its liabilities and intangible assets, such as goodwill. Unemployment Rate measures the number of people actively looking for a job as a percentage of the labor force. Volatility is a statistical measure of the dispersion of returns for a given security or market index which can either be measured by using the standard deviation or variance between returns from that same security or market index. Commonly, the higher the volatility, the riskier the security. 10 Principles of Value Investing™ consist of the following criteria for selecting securities: (1) catalyst for recognition; (2) low price in relation to earnings; (3) low price in relation to cash flow; (4) low price in relation to book value; (5) financial soundness; (6) positive earnings dynamics; (7) sound business strategy; (8) capable management and insider ownership; (9) value of company; and (10) positive technical analysis.

top