Pursues long–term capital appreciation by dynamically investing in a high conviction portfolio across market caps
The Heartland Opportunistic Value Equity Strategy seeks long-term capital appreciation by dynamically investing in a high conviction portfolio (40-60 holdings) across market caps. The Strategy utilizes Heartland's 10 Principles of Value Investing™ for stock analysis along with a collection of rules and tools designed to construct the overall portfolio such that stock selection is the primary driver of relative performance. Leveraging Heartland's long history in small and mid-cap value research, the Strategy aims to combine the best ideas while opportunistically identifying large-cap stocks to create a portfolio intended to outperform the Russell® 3000 Value Index over a market cycle. The narrow focus on specific catalysts that may unlock value adds discipline and consistency.

Minimum: $500,000
| Account Size | Annual Rate (%) |
|---|---|
| First $5 million | 1.00 |
| Next $10 million | 0.85 |
| Above $15 million | Negotiable |
3/31/2026
Scroll over to view complete data
| Since Inception (%) | 10-Year (%) | 5-Year (%) | 3-Year (%) | 1-Year (%) | YTD (%) | QTD (%) | |
|---|---|---|---|---|---|---|---|
| Opportunistic Value Equity Composite (Net of Advisory Fees)** | 9.98 | 10.63 | 9.72 | 12.58 | 11.58 | 4.02 | 4.02 |
| Opportunistic Value Equity Composite (Net of Bundled Fees) | 8 | 8.8 | 8.18 | 11.05 | 10.05 | 3.66 | 3.66 |
| Russell 3000® Value | 7.93 | 10.52 | 9.19 | 14.26 | 16.37 | 2.23 | 2.23 |
|
|
2025 (%) |
2024 (%) |
2023 (%) |
2022 (%) |
2021 (%) |
2020 (%) |
2019 (%) |
2018 (%) |
2017 (%) |
2016 (%) |
2015 (%) |
2014 (%) |
2013 (%) |
2012 (%) |
2011 (%) |
2010 (%) |
2009 (%) |
2008 (%) |
2007 (%) |
2006 (%) |
2005 (%) |
|---|---|---|---|---|---|---|---|---|---|---|---|---|---|---|---|---|---|---|---|---|---|
|
Opportunistic Value Equity Composite (Net of Advisory Fees)** |
8.60 | 11.83 | 14.66 | -1.01 | 25.80 | -1.79 | 19.04 | -4.13 | 13.63 | 18.83 | -4.05 |
4.01 |
34.59 |
13.43 |
-7.88 |
17.51 |
35.82 |
-32.38 |
4.62 |
13.93 |
14.90 |
|
Opportunistic Value Equity Composite (Net of Bundled Fees) |
7.11 | 10.30 | 13.09 | -2.42 | 23.78 | -3.59 | 16.73 | -6.01 | 11.40 | 16.52 | -5.92 |
1.99 |
32.00 |
11.25 |
-9.70 |
15.24 |
33.23 |
-33.64 |
2.62 |
11.80 |
12.80 |
|
Russell 3000® Value |
15.71 | 13.98 | 11.66 | -7.98 | 25.37 | 2.87 | 26.26 | -8.58 | 13.19 | 18.40 | -4.13 |
12.70 |
32.69 |
17.55 |
-0.10 |
16.23 |
19.76 |
-36.25 |
-1.01 |
22.34 |
6.85 |
*Source: FactSet Research Systems, Inc., Russell Investment Group, and Heartland Advisors, Inc.
YTD and QTD returns are not annualized. The Strategy's inception date is 9/30/1999.
**Shown as supplemental information.
The US Dollar is the currency used to express performance. Returns are presented net of advisory fees and net of bundled fees and include the reinvestment of all income. The returns net of bundled fees were calculated by subtracting the highest applicable sponsor portion of the separately managed wrap account fee from the net of advisor fees return.
3/31/2026
Scroll over to view complete data
| Weighted Average Market Cap ($) | Median Market Cap ($) | Trailing 1-Year Turnover (%) | |
|---|---|---|---|
| Opportunistic Value Equity Composite | 3727.4 billion | 18.9 billion | 34.9 |
| Russell 3000® Value | 353.9 billion | 2.3 billion | - |
Source: FactSet Research Systems Inc., Russell Investment Group, and Heartland Advisors, Inc.
3/31/2026
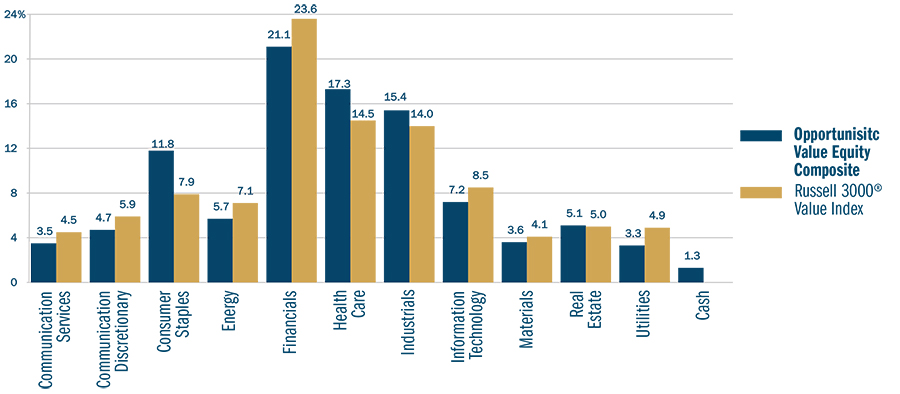
Source: FactSet Research Systems Inc., Russell Investment Group.
Composite statistics shown as percentage of equity investments
3/31/2026
Scroll over to view complete data
| Ticker | Holding | % of Account | Industry |
|---|---|---|---|
| GOOGL | Alphabet Inc. (Class A) | 6.3 | Interactive Media & Services |
| JNJ | Johnson & Johnson | 3.4 | Pharmaceuticals |
| BRK/B | Berkshire Hathaway, Inc. (Class B) | 3.3 | Financial Services |
| JBHT | JB Hunt Transport Services, Inc. | 3.1 | Ground Transportation |
| TDY | Teledyne Technologies, Inc. | 2.9 | Electronic Equipment Instruments & Components |
| BDX | Becton, Dickinson & Company | 2.9 | Health Care Equipment & Supplies |
| DGX | Quest Diagnostics, Inc. | 2.8 | Health Care Providers & Services |
| CASS | Cass Information Systems, Inc. | 2.8 | Financial Services |
| PSA | Public Storage | 2.8 | Specialized REITs |
| WSO | Watsco Inc | 2.6 | Trading Companies & Distributors |
| % of Total Net Assets | 32.9 | ||
3/31/2026
Scroll over to view complete data
| Alpha* | Standard Deviation (%)* | Beta | Info Ratio | Sharpe Ratio | Upside Capture (%)* | Downside Capture (%)* | R- Squared (%) | Active Share | |
|---|---|---|---|---|---|---|---|---|---|
| Opportunistic Value Equity Composite (Net of Advisory Fees) | 1.17 | 14.13 | 0.92 | 0.13 | 0.44 | 93.68 | 89.61 | 92.1 | 88.6 |
| Russell 3000® Value | 0 | 14.7 | 1 | 0 | 0.39 | 100 | 100 | 100 | 0 |
*Annualized
Source: FactSet Research Systems Inc., Russell Investment Group
Alpha, beta, and information ratio are versus the Russell 3000® Value Index.
Certain performance, portfolio composition, and/or risk analysis data may be preliminary.
40 years of industry experience
27 years of experience at Heartland
©2026 Heartland Advisors | 790 N. Water Street, Suite 1200, Milwaukee, WI 53202 | Business Office: 414-347-7777 | Financial Professionals: 888-505-5180 | Individual Investors: 800-432-7856
Past performance does not guarantee future results. Performance represents past performance, and current returns may differ.
Heartland Advisors, Inc. (the "Firm") claims compliance with the Global Investment Performance Standards (GIPS®). The Firm is a wholly owned subsidiary of Heartland Holdings, Inc., and is registered with the Securities and Exchange Commission. For a complete list and description of Heartland Advisors composites and/or a presentation that adheres to the GIPS® standards, contact the Institutional Sales Team at Heartland Advisors, Inc. at the address listed below.
The U.S. dollar is the currency used to express performance.
The inception date for the Opportunistic Value Equity Strategy is 9/30/1999.
In addition to stocks of large companies, the Opportunistic Value Equity Strategy invests in stocks of small- and mid-cap companies that are generally less liquid than large companies. The performance of these holdings generally will increase the volatility of the strategy’s returns.
Value investments are subject to the risk that their intrinsic value may not be recognized by the broad market.
Portfolio holdings are subject to change. Current and future portfolio holdings are subject to risk.
Sector and Industry classifications are sourced from GICS®.The Global Industry Classification Standard (GICS®) is the exclusive intellectual property of MSCI Inc. (MSCI) and S&P Global Market Intelligence (“S&P”). Neither MSCI, S&P, their affiliates, nor any of their third party providers (“GICS Parties”) makes any representations or warranties, express or implied, with respect to GICS or the results to be obtained by the use thereof, and expressly disclaim all warranties, including warranties of accuracy, completeness, merchantability and fitness for a particular purpose. The GICS Parties shall not have any liability for any direct, indirect, special, punitive, consequential or any other damages (including lost profits) even if notified of such damages.
Representative account chosen based on composite membership, not on performance-based criteria. Other accounts within the strategy may have different holdings.
Representative account holdings are preliminary, may not be reconciled, and may be updated when reconciled.
Certain security valuations and forward estimates are based on Heartland Advisors' calculations. Certain outliers may be excluded. Any forecasts may not prove to be true.
Economic predictions are based on estimates and are subject to change.
Heartland’s investing glossary provides definitions for several terms used on this page.
CFA® is a registered trademark owned by the CFA Institute.
Separately managed accounts and related investment advisory services are provided by Heartland Advisors, Inc., a federally registered investment advisor. ALPS Distributors, Inc., is not affiliated with Heartland Advisors, Inc.


