Heartland Advisors

Heartland Mid Cap Value Strategy 3Q23 Portfolio Manager Commentary

Executive Summary 

  • Sectors that benefit from inflation, such as Energy and Financials, assumed market leadership in the quarter while those that are less favorably disposed to inflation, including Consumer and Healthcare, underperformed.  
  • The narrative of a “soft landing” for the economy continued to take hold, even as consumers felt the pinch of higher interest rates and inflation. 
  • Ultimately, this was a quarter where it paid to ignore noise surrounding the health of the economy and focus on bottoms-up security selection.

​Third Quarter Market Discussion

It’s an oft-heard refrain: To succeed in the long run, investors must ignore the short-term noise in the markets and focus on the things that really matter, like fundamentals and bottom-up security selection. This was a quarter where that advice hit home, as little seemed to transpire other than noise.

After climbing in July and slumping in August, stocks ended down in the three months ended Sept. 30. The S&P 500 Index finished the third quarter at -3.27% while the Russell Midcap® Index ended at -3.25%. 

All this sound and fury signifying nothing arose, in part, from the mixed signals in economic data and the market itself. For instance, while employment and CPI/PPI releases kept feeding the “soft landing” narrative, several retailers issued earnings updates highlighting further pressures on both demand and operating costs. The pending expiration of student loan payment forgiveness poses another potential challenge to consumers already facing the effects of elevated interest rates and inflation. 

This is evidenced by consumer confidence in the current state of the economy remaining quite stable, as measured by the Conference Board. However, expectations for the coming six months have been sliding. History shows that current sentiment doesn’t tend to drop until just before or immediately after the start of a recession. With this in mind, we find the divergence between current conditions and future expectations noteworthy (see chart below).

Consumer Confidence v. Real GDP

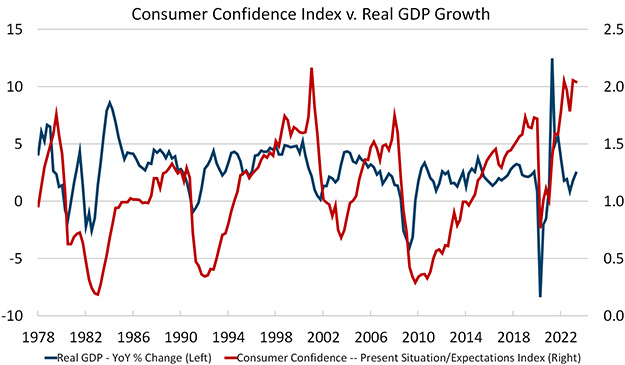
Source: FactSet Research Systems Inc., Quarterly data from 3/31/1978 to 6/30/2023. This chart represents consumer confidence which is defined as present situation/expectations index compared to the real GDP – year over year percent change. All indices are unmanaged. It is not possible to invest directly in an index. Past performance does not guarantee future results.

The crosscurrents facing the consumer, along with stresses in the banking and commercial real estate industries, leave us questioning the validity of the soft-landing narrative. That said, we remain cautiously optimistic about our opportunity set. In this backdrop, we continue to focus on our strength: disregarding the macro noise and trying to control things that we can, such as identifying and analyzing promising, underappreciated stocks trading at attractive prices.

Attribution Analysis

The Mid Cap Value portfolio was down approximately 2.2% in the third quarter, outperforming the Russell Midcap® Value Index, which was down 4.46%. This was almost entirely attributable to stock selection, which was particularly strong in the Utilities and Industrials sectors and provided the largest contributions to relative performance. Our positions in the Energy (+23.28%) and Financials (+2.5%) sectors provided the largest gains for the quarter. 

Portfolio Activity

Some value investors prefer owning high-quality companies (we consider this the “value” bucket of our investible universe) while others focus on deeply discounted companies that have produced poor economic returns over time but have statistically low valuations (we call this the “deep value” bucket of midcap investing).

Just as growth and value take turns outperforming, these two styles tend to alternate leadership within the value asset class. The representation of each bucket in the Russell Midcap® Value Index has shifted materially over time. Today, value and deep value have approximately equal weights in the benchmark. However, the value bucket represented as much as 65% in 2000 and as little as 25% in 2009. Given these dramatic shifts, ignoring either one of these buckets does not seem prudent, as it can introduce an unintended top-down bet into the portfolio.

We deliberately construct our portfolio with these two buckets in mind, without relying on top-down forecasts to favor one subset over the other. We build our portfolio through fundamental stock selection, relying on our 10 Principles of Value Investing™ within a two-bucket approach.

With that background in mind, the following three holdings are worth highlighting:

Financials. First American Financial (FAF), the second-largest title insurance provider in the U.S., is a quintessential value bucket example (buying a high-quality operator at an attractive valuation when their business is in a recession). 

While most people don’t think about title insurance when purchasing a home, policies indemnify homeowners and lenders against title defects that could result in significant losses arising from back taxes, liens, and other claims. Rising mortgage rates over the past two years have weighed on First American shares, as 30-year fixed rate residential mortgages more than doubled from around 3% at the end of 2021 to more than 7% today. Residential refinance volumes plunged 85% by late 2022, while new purchase volumes fell more than 40%. As a result, FAF’s earnings expectations are down nearly 50% relative to the cycle peak. 

However, the year-over-year decline in the Mortgage Bankers Association Purchase Index is getting “less bad,” which is often when the share prices of good companies begin to recover (as long as the market considers the improvement to be sustainable). Meanwhile, management has taken several self-help steps to improve profitability. Examples include exiting unprofitable property and casualty operations and automating manual processes, which should boost margins. 

FAF shares trade at just 12X earnings, based on forecasts for the next 12 months. While a P/E ratio of 12X is in line with the insurance industry, we do not believe the broader industry has the same cyclical earnings upside as First American. Historically, title insurers have traded at 15X or higher early in a cyclical recovery.

Energy. NOV Inc. (NOV), our largest holding, is a deep value company benefiting from a self-help business strategy. NOV is a leading oilfield services company that provides technical expertise, advanced equipment, and operational support for the oil and gas industry. 

The company survived a prolonged bear market for oil prices that lasted from 2014 through COVID-19 related demand destruction in 2020. During this time, the industry went into capital starvation mode. NOV used the industry downturn to streamline its cost structure and retire debt in order to maintain an industry-leading balance sheet. The company has eliminated $850 million in structural fixed costs since the start of 2019.

Despite heavy cost-cutting, NOV never stopped developing new value-added product applications, which strengthened its position as weaker competitors went away and the industry outlook subsequently improved. This should allow NOV to generate strong returns on capital as the energy upcycle unfolds, with offshore wind and other renewables providing capital-efficient ancillary growth for the company.

Consumer Staples. During the quarter, we initiated a new position in Spectrum Brands Holdings (SPB), another deep value company with multiple self-help catalysts. 

After several divestitures in recent years, Spectrum is mostly a pureplay Consumer Staples company focusing on pet care and home and garden supplies, including recognizable brands such as Spectracide lawn and garden products and SmartBone dog treats.

SPB is in the process of transforming itself from an acquisition-oriented holding company into an integrated operating company with sharper focus. As part of that process, the company recently divested its Hardware and Home Improvement segment, selling it to the Swedish conglomerate Assa Abloy for $4.3 billion in cash. We owned Spectrum when this divestiture was originally announced but exited our position when the Department of Justice (DOJ) sued to block the sale. That action threatened to derail SPB’s efforts to improve its balance sheet and shed a highly discretionary segment that was noncore to the company’s strategy.

We recently got clarity on this overhang, when the DOJ reached a settlement with Assa Abloy, allowing the sale to go through. This gives SPB ample capacity to repurchase shares at a steep discount to intrinsic value while setting the stage for operational improvements. Meanwhile, the stock trades at just 7X next year’s EBITDA and 5X to 5.5X normalized EBITDA.

Outlook 

The third quarter showed investors that even if one thinks that they know the general direction the economy is headed, market cycles never unfold in a straight line. We have some continued concerns about parts of the economy, such as the banking and commercial real estate industries. That said, we understand the risks of constructing a portfolio around a macro narrative that may not unfold exactly as envisioned. 

That’s why in times like this, we focus on what we can control: bottom-up security selection guided by our 10 Principles of Value Investing™, which focuses on financial soundness, skilled management, compelling business strategies, positive earnings dynamics, attractive valuations, and strong catalysts for recognition.

Please wait while we gather your results.

Portfolio Management Team

Heartland Advisors Value Investing Portfolio Manager Colin McWey

Colin McWey

Vice President and Portfolio Manager

Heartland Advisors Value Investing Portfolio Manager Will Nasgovitz

Will Nasgovitz

CEO and Portfolio Manager

Heartland Advisors Value Investing Portfolio Manager Troy McGlone

Troy McGlone

Vice President and Portfolio Manager

Composite Returns*

Scroll over to view complete data

Source: FactSet Research Systems Inc., Russell Investment Group, and Heartland Advisors, Inc.
*Yearly and quarterly returns are not annualized. The Strategy's inception date is 9/30/1996. 

The US Dollar is the currency used to express performance. Returns are presented net of advisory fees and net of bundled fees and include the reinvestment of all income. 

Mid Cap Value Strategy Quick Links

Factsheet


Download PDF

Commentary


View Commentary

Attribution & Contribution Reports

Sign In

Holdings


Sign In


Email Sign Up


©2024 Heartland Advisors | 790 N. Water Street, Suite 1200, Milwaukee, WI 53202 | Business Office: 414-347-7777 | Financial Professionals: 888-505-5180 | Individual Investors: 800-432-7856

Past performance does not guarantee future results.

The Mid Cap Value Strategy seeks long-term capital appreciation by investing in mid-size companies as defined by the market capitalization range of the Russell Midcap® Index. This focused portfolio seeks companies with strong underlying business franchises priced at a discount to their intrinsic worth that have temporarily fallen out of favor.

The Mid Cap Value Strategy invests in mid–sized companies on a value basis. Mid-sized securities generally are more volatile and less liquid than those of larger companies.

Value investments are subject to the risk that their intrinsic value may not be recognized by the broad market.

Heartland Advisors, Inc. (the "Firm") claims compliance with the Global Investment Performance Standards (GIPS®). The Firm is a wholly owned subsidiary of Heartland Holdings, Inc., and is registered with the Securities and Exchange Commission. For a complete list and description of Heartland Advisors composites and/or a presentation that adheres to the GIPS® standards, contact the Institutional Sales Team at Heartland Advisors, Inc. at the address listed below.

As of 9/30/2023, First American Financial (FAF), NOV Inc. (NOV), and Spectrum Brands Holdings (SPB), represented 2.50%, 4.85%, and 1.58% of the Mid Cap Value Composite’s net assets, respectively.  

The future performance of any specific investment or strategy (including the investments discussed above) should not be assumed to be profitable or equal to past results. The performance of the holdings discussed above may have been the result of unique market circumstances that are no longer relevant. The holdings identified above do not represent all of the securities purchased, sold or recommended for the Advisor’s clients.

Statements regarding securities are not recommendations to buy or sell.

Portfolio holdings are subject to change. Current and future portfolio holdings are subject to risk.

In certain cases, dividends and earnings are reinvested.

GIPS® is a registered trademark of CFA Institute. CFA Institute does not endorse or promote this organization, nor does it warrant the accuracy or quality of the content contained herein.

Separately managed accounts and related investment advisory services are provided by Heartland Advisors, Inc., a federally registered investment advisor. ALPS Distributors, Inc., is not affiliated with Heartland Advisors, Inc.

The statements and opinions expressed in this article are those of the presenter(s). Any discussion of investments and investment strategies represents the presenters’ views as of the date created and are subject to change without notice. The opinions expressed are for general information only and are not intended to provide specific advice or recommendations for any individual. The specific securities discussed, which are intended to illustrate the advisor’s investment style, do not represent all of the securities purchased, sold, or recommended by the advisor for client accounts, and the reader should not assume that an investment in these securities was or would be profitable in the future. Certain security valuations and forward estimates are based on Heartland Advisors’ calculations. Any forecasts may not prove to be true. 

Economic predictions are based on estimates and are subject to change.

There is no guarantee that a particular investment strategy will be successful.

Sector and Industry classifications are sourced from GICS®.The Global Industry Classification Standard (GICS®) is the exclusive intellectual property of MSCI Inc. (MSCI) and S&P Global Market Intelligence (“S&P”).  Neither MSCI, S&P, their affiliates, nor any of their third party providers (“GICS Parties”) makes any representations or warranties, express or implied, with respect to GICS or the results to be obtained by the use thereof, and expressly disclaim all warranties, including warranties of accuracy, completeness, merchantability and fitness for a particular purpose.  The GICS Parties shall not have any liability for any direct, indirect, special, punitive, consequential or any other damages (including lost profits) even if notified of such damages.

Heartland Advisors defines market cap ranges by the following indices: micro-cap by the Russell Microcap®, small-cap by the Russell 2000®, mid-cap by the Russell Midcap®, large-cap by the Russell Top 200®.

Because of ongoing market volatility, performance may be subject to substantial short-term changes.

Dividends are not guaranteed and a company’s future ability to pay dividends may be limited. A company currently paying dividends may cease paying dividends at any time. 

There is no assurance that dividend-paying stocks will mitigate volatility. 

CFA® is a registered trademark owned by the CFA Institute.

Russell Investment Group is the source and owner of the trademarks, service marks and copyrights related to the Russell Indices. Russell® is a trademark of the Frank Russell Investment Group.

Data sourced from FactSet: Copyright 2024 FactSet Research Systems Inc., FactSet Fundamentals. All rights reserved.

Heartland’s investing glossary provides definitions for several terms used on this page.

Bear Market occurs when the price of a group of securities is falling or is expected to fall. Bottom-up is an investment approach that de-emphasizes the significance of economic and market cycles. This approach focuses on the analysis of individual stocks and the investor focuses his or her attention on a specific company rather than on the industry in which that company operates or on the economy as a whole. Consumer Confidence Index (Conference Board): measures Americans’ attitudes about current and future economic conditions. It is based on a monthly survey of 5,000 households conducted by The Conference Board and is benchmarked to a base year of 100 in 1985. Cyclical Stocks cover Basic Materials, Capital Goods, Communications, Consumer Cyclical, Energy, Financial, Technology, and Transportation which tend to react to a variety of market conditions that can send them up or down and often relate to business cycles. Consumer Price Index (CPI) is the most widely used measure of consumer price inflation. The CPI measures the average change over time in the prices paid by urban consumers for goods and services. The Bureau of Labor Statistics (BLS) of the U.S. Department of Labor collects the CPI price information and calculates the CPI statistics. Earnings Before Interest, Taxes, Depreciation and Amortization (EBITDA) measures a company’s financial performance. It is used to analyze and compare profitability between companies and industries because it eliminates the effects of financing and accounting decisions. Gross Domestic Product (GDP) is the monetary value of all the finished goods and services produced within a country’s borders in a specific time period, though GDP is usually calculated on an annual basis. Inflation Risk is the possibility that the value of assets or income will decrease as inflation shrinks the purchasing power of a currency. Intrinsic Value is the actual value of a company or an asset based on an underlying perception of its true value including all aspects of the business, in terms of both tangible and intangible factors. This value may or may not be the same as the current market value. Margin of Safety is a principle of investing in which an investor only purchases securities when the market price is significantly below its intrinsic value. Price/Earnings Ratio of a stock is calculated by dividing the current price of the stock by its trailing or its forward 12 months’ earnings per share. Producer Price Index (PPI) is a family of indices produced by the Bureau of Labor Statistics (BLS) that measures the average change over time in the selling prices received by domestic producers for their output. PPIs measure price change from the perspective of the seller. Russell Investment Group is the source and owner of the trademarks, service marks and copyrights related to the Russell Indices. Russell® is a trademark of the Russell Investment Group. Russell Midcap® Index measures the performance of the 800 smallest companies in the Russell 1000® Index. All indices are unmanaged. It is not possible to invest directly in an index. Selection Effect of the Attribution Analysis is the portion of the portfolio excess return attributable to choosing different securities within groups from the benchmark. S&P 500 Index is an index of 500 U.S. stocks chosen for market size, liquidity and industry group representation and is a widely used U.S. equity benchmark. All indices are unmanaged. It is not possible to invest directly in an index. 10 Principles of Value Investing™ consist of the following criteria for selecting securities: (1) catalyst for recognition; (2) low price in relation to earnings; (3) low price in relation to cash flow; (4) low price in relation to book value; (5) financial soundness; (6) positive earnings dynamics; (7) sound business strategy; (8) capable management and insider ownership; (9) value of company; and (10) positive technical analysis.

top