Second Quarter Market Discussion
After taking risk off the table earlier in the year, investors scrambled back during the second quarter. Sparked by better-than-expected inflation data, the resolution of the debt ceiling crisis in Washington, and newfound hope that the Federal Reserve might be done tightening, the Russell Mid-Cap® Index gained almost 4% in the three months ended June 30. Growth beat Value during the quarter, and speculative growth did even better.
While the Federal Reserve kept rates steady at its June Federal Open Market Committee (FOMC) meeting, the Central Bank still appears to be leaning toward cooling the economy. The Federal Reserve’s so-called “dot plot,” which depicts the expectations of each FOMC member, shows the median forecast for the Federal Funds rate currently at 5.6%. This would suggest the possibility of further monetary policy tightening later this year. If this became reality, we question how well-received it would be in the speculative parts of the market that have led so far in 2023.
Even if the Federal Reserve stops raising rates, we believe the economy will continue to face headwinds given that monetary policy takes time to be fully reflected in economic activity. Funding stress may have peaked, but we anticipate further credit stress in the coming quarters, as the effects of higher borrowing costs begin to take their toll. Consumer loan delinquencies are already climbing, led by late payments on credit card and automobile loans, which have hit multi-year highs. While commercial real estate loans have not experienced broad-based credit stress yet, that could change in the coming quarters as loans underwritten in a lower interest rate environment come due and the cost to hedge against rising rates increases.
In this tighter credit environment, balance sheet strength, while always important, should be rewarded. We also remain steadfast in our conviction that well-selected mid-cap value stocks will outperform broad market indices over a multi-year time horizon. For starters, returns in the mid-cap universe have not been driven by just a handful of stocks. This stands in contrast to the S&P 500® Index, where seven giant tech companies drove the vast majority of the Index’s recent gains.
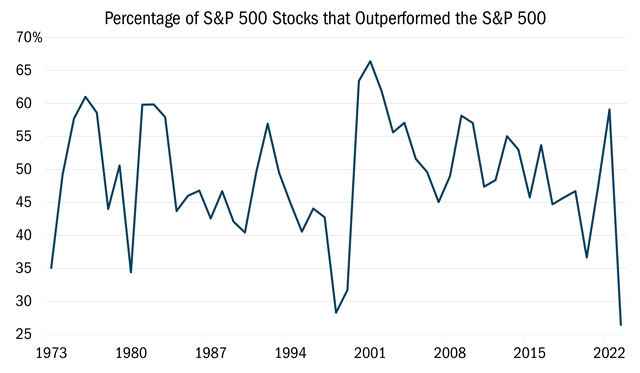
Source: Ned Davis Research, yearly data from 12/31/1973 to 12/31/2022 and partial year data from 1/1/2023 to 6/22/2023. This chart represents the percentage of S&P 500® Stocks that outperformed the S&P 500® over the calendar year. All indices are unmanaged. It is not possible to invest directly in an index. Past performance does not guarantee future results.
In the S&P 500®, the top 10 names account for more than 30% of the benchmark. Among mid-cap value, the top 10 stocks represent only around 7% of the Index. Historically, narrow markets tend to be associated with poor performance while wider breadth has correlated with stronger price gains.
We consider this to be a great backdrop for fundamentally driven, long-term investors, with many holdings potentially being worth considerably more in three to five years, while others may never again fetch the valuations they received in 2021.
Attribution Analysis
Our Fund was up 4.78% in the second quarter and outperformed the Russell Mid-Cap® Value Index, which returned 3.86%, owing almost entirely to stock selection, particularly in the Technology, Consumer Discretionary, and Utilities sectors. Stock selection was positive in seven of the eleven sectors furthering the Fund’s consistent performance.
Portfolio Activity
While the second quarter was decidedly better for growth stocks, we think value will have an advantage going forward. That said, we do not rely on top-down forecasts to pick stocks. We build our portfolio through bottom-up stock selection, relying on our 10 Principles of Value Investing™ within a two-bucket approach.
Among Value investors, there are those who prefer owning high-quality companies trading at decent bargains (“value”) and others who focus on deeply discounted companies that have produced poor economic returns over time (“deep value”). Just as growth and value tend to take turns outperforming, these two styles within value investing also tend to alternate market leadership. Within the mid-cap space, choosing one while ignoring the other does not seem prudent, as this can cause a top-down bet to be introduced into the portfolio.
We remain confident that effective stock selection in both areas will provide opportunities for good relative performance, and potentially downside protection, in a market where many uncertainties remain.
 Consumer Discretionary. Hasbro (HAS) is one of the world’s leading toy and game manufacturers with key franchises such as Peppa Pig, Play-Doh, My Little Pony, and Playskool. For several years, Hasbro’s returns on invested capital have been going the wrong way. That said, we believe the shares possess compelling turnaround and self-help potential.
The company has made progress working down excess inventory at retailers. This progress comes in front of an impressive slate of new products and entertainment releases, including movies, which should help catalyze better sales. Hasbro is streamlining operations and strategic focus across its products/gaming/entertainment segments by allocating more resources to growing its larger brands, while simultaneously de-emphasizing smaller brands that have created unnecessary distraction in recent years. Additionally, we expect management to complete a partial divestiture of noncore assets in its entertainment segment to reduce expenses and relieve the burden of inefficiently deployed capital. Furthermore, we are encouraged by Hasbro’s undertaking of a $250-300 million multi-year cost-saving initiative and a necessary supply chain management overhaul.
Our purchase of Hasbro shares was motivated by these operational/strategic changes, our confidence in the company’s ability to significantly expand operating margins, and compelling multiples of earnings, cashflow and invested capital.
 Industrials. Stericycle (SRCL) is the largest medical waste disposal and compliance company in the U.S. Over the past few years, the company has transformed itself from an aggressive, acquisition-driven company to one focused on organic growth, integrating core assets, reducing debt, and expanding profit margins. Toward that end, the company has undertaken several self-help strategies. This includes divesting non-core operations in order to focus on its core businesses of medical waste disposal and document destruction in the U.S. and Europe. Today, SRCL is largely complete with this portfolio reshaping and has successfully reduced debt to target levels. The critical action items left for the company pertain to integrating technology systems and demonstrating further progress in operational execution. In summary, SRCL is morphing from a ”holding company” into an “operating company”, with the latter offering far better prospects of rewarding shareholders.
Candidly, this is not our first time owning SRCL. The first time around, we became shareholders far too early in the company’s turnaround efforts and exited the position. However, we continue to monitor the progress made under a much-improved management team and expect a better outcome for shareholders going forward. Regulated waste companies with leading market shares and secular growth, like SRCL, trade at far more expensive multiples of EBITDA and free cash flow. Additionally, the company is significantly underearning its potential. As this dynamic changes, we can envision a virtuous circle where the company earns progressively higher trading multiples on higher earnings power.
 Healthcare. Centene Corporation (CNC) is one of the largest managed health care insurance providers in the U.S. and the largest player in Medicaid. The stock has underperformed this year, as CNC faces reimbursement headwinds including a reduction in its 2024 Medicare Advantage premiums and higher healthcare utilization from the return of elective procedures. Investors also fear a potential loss of insured lives when Medicaid eligibility, which was expanded during the pandemic, gets redetermined in 2023-2024.
CNC’s historical results have lacked the consistency demonstrated by premier large managed care companies. However, since 2021, the company has steadily upgraded its leadership ranks from the CEO on down through the executive ranks and line-of-business leaders. CNC’s executive leadership is comprised of industry veterans with a demonstrated record of success. Their executive compensation is clearly aligned with shareholder value creation, and they recently bought large amounts of CNC stock personally in the open market, demonstrating confidence in their prospects. Self-help initiatives are well underway and include noncore divestitures, material expense streamlining, improved digital capabilities, improved provider contracting, and meaningful share repurchases.
In our estimation, the market is too focused on near-term overhangs that will prove temporary and disregards the substantial value creation opportunities that lie ahead. CNC trades at just 10X 2023 earnings compared to peers valued at mid/upper teens P/E ratios. After a brief pause caused by the reimbursement headwinds in 2024, we expect CNC to resume its 12-15% EPS growth rate, comparable to leading industry operators. This should help close the valuation gap.
Outlook
The risk-on, risk-off aspect of this market tends to garner headlines. Nevertheless, we remain focused on bottom-up stock selection because it is within our control unlike the stock market. We also know that it remains a key determinant of success for our shareholders.
Fundamentally Yours, the Heartland Team.