Heartland Advisors

Heartland Small Cap Value Strategy 2Q25 Portfolio Manager Commentary

 Executive Summary

  • The Heartland Small Cap Strategy beat its benchmark in the second quarter and has outperformed in the past 1, 3, 5, and 10 years as well as since inception.
  • The valuation case for small caps was strong to begin with. Now, earnings are expected to grow double digits later this year. 
  • As active fundamental investors, what gives us added confidence is our time-tested process, which helps security selection become a driver of performance and mitigates the impact of allocations.

"It’s a small world after all.”
— The Sherman Brothers

For the fifth time in the past six quarters, the Russell 2000® Index trailed the S&P 500. So, this may seem like an odd time to quote a Disney Park ride and declare that “it’s a small world after all.” But investing is generally not about peering back at the rear-view mirror; it’s about looking forward to what lies ahead. And as that picture comes into sharper focus, two things give us confidence about small stocks: the fundamentals and our process.

From an earnings and valuation standpoint, the case for small caps isn’t just historically compelling — we believe it’s getting stronger. For example, profits for this group, which had been flat in the first half of this year, are expected to climb by double-digits over the next six months. This comes as EPS growth for the mega-cap Magnificent 7 is decelerating. Yet small stocks are still priced at a steep 26% discount to large, according to The Leuthold Group, marking only the fourth time in the past 40 years that this gap was 20% or greater. 

There are plenty of other tailwinds to consider: Global liquidity is starting to improve. The yield curve is expected to steepen later this year assuming the Federal Reserve begins to cut short-term interest rates. And there’s $7 trillion sitting on the sidelines in money market accounts and short-term instruments at a time when investors are notably under-allocated to small caps.

One reason for the underweight may have to do with misconceptions about this market. Small stocks are not all risky startups or unproven enterprises going up against established, giant industry leaders. These companies are often bigger than investors assume and, in some cases, are the dominant players within their fields.

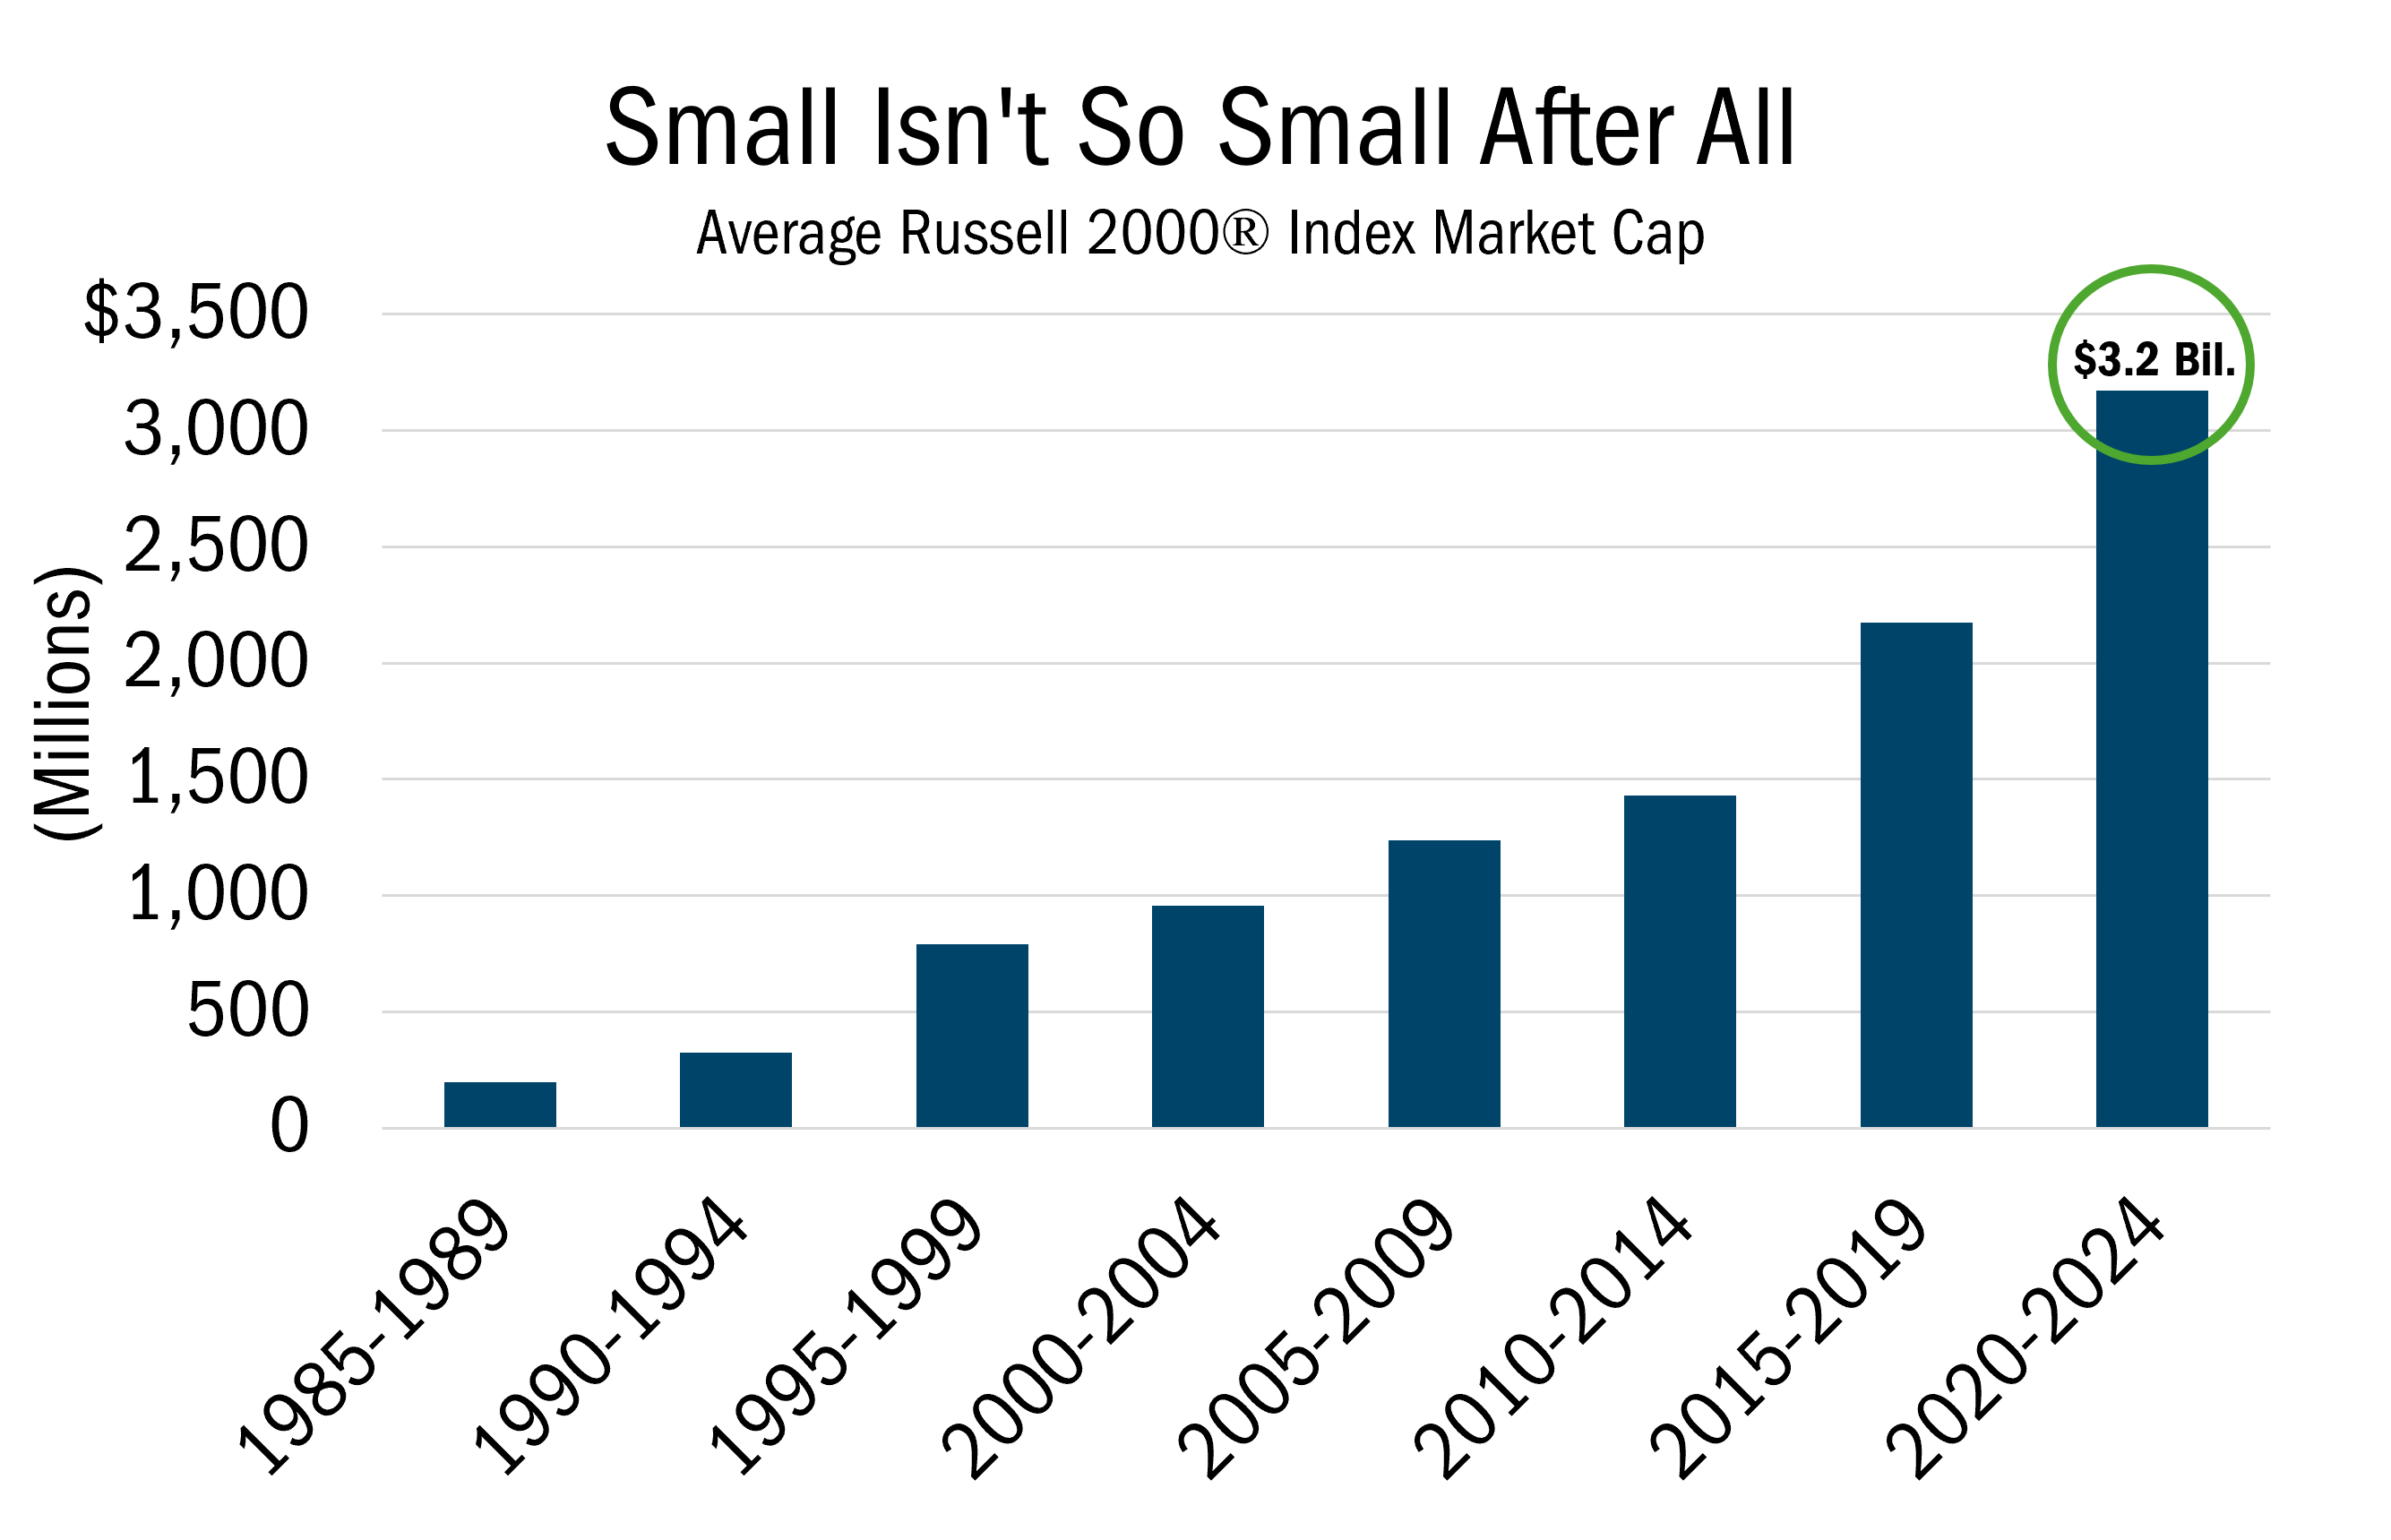
Source: FactSet Research Systems Inc., based on monthly data from 1985 to 2024. This chart represents the Russell 2000® Index weighted average market cap over 5 year time period intervals. All indices are unmanaged. It is not possible to invest directly in an index. Past performance does not guarantee future results.

Of course, small stocks tend to be more volatile and can be punished more severely when there’s a sudden flight to safety or if the market feels it has incorrectly assessed the situation. Yet, we are confident that with the right process in place, active managers can address those risks while maintaining exposure to an asset class which, over the long sweep of history, has outperformed large caps by a considerable margin — According to Morningstar since 1926, a positive 1.4 percentage points a year, based on compound annual returns.

As part of the risk management process at Heartland, we employ guardrails for all our Strategies. For example, sector bands are used to restrict us from being too far over or underweight our benchmark’s allocations. Throughout our history, we’ve also tracked a grid of attributes for every company we own, giving us a better sense of the prospects for each business relative to its peers over time. If we see month-to-month deterioration in a holding’s grid score, this gives our team reason to relitigate the merits of the investment, discuss optimal position sizing, debate new alternatives, and re-investigate the company’s strategy and likelihood for success. 

Without this debate, our perspective could be skewed and locked into older positions that may no longer make sense. We believe these processes have contributed to the consistency of the Strategy’s performance over time. For one thing, the guardrails have helped limit the negative effect of detractors in our portfolio, which can be just as important as identifying positive contributors. Over the past year, the drag on performance from our worst-performing holdings is 52% less than it was during the 2014-2016 period. This, in addition to our improved industry awareness and our continued use of the grid, has played a meaningful part in our results.

Another major factor, of course, has been our 10 Principles of Value Investing,™ which guide every decision we make and focus our attention on attractively priced, well-run companies with strong balance sheets and business strategies. Those are enduring values that have not only led the Strategy since its inception, they have served as Heartland’s North Star for more than 40 years. 

Attribution Analysis & Portfolio Activity

For the quarter, the Strategy gained 14.92%, compared with the 4.97% return for the Russell 2000® Value Index. We outperformed the benchmark not only during the last three months but also over past 1, 3, 5, and 10 years and since inception. Stock selection accounted for almost all our outperformance over the past three months and was particularly strong in Energy, Consumer Discretionary, Financials, and Utilities. 

We believe this market affords active small cap value managers terrific opportunities. Our portfolio, for instance, sports an average valuation roughly half that of the S&P 500, based on P/E ratios. And unlike Russell 2000® Index funds, which must own all the stocks in the benchmark — including the 34% of companies that are unprofitable — we can focus on attractively priced companies with positive earnings dynamics.

Recently, we have been looking at other attributes as well. While tariff fears subsided somewhat in the second quarter, their impact on profits remains a key concern. In general, small stocks tend to be relatively less exposed to tariff impacts because they tend to be more domestically oriented. But some companies offer an even greater natural hedge. 

Photronics, Inc. (PLAB) is a perfect example of common misconceptions surrounding small stocks. PLAB makes photomasks used to transfer circuit patterns onto semiconductor wafers during the fabrication process, operating manufacturing facilities globally. The company’s modest $1.1 billion market capitalization belies the fact that it is the largest merchant photomask manufacturer in the world. Plus their solid balance sheet, over $550 million in cash and cash equivalents, with minimal debt provides a strong ballast.

PLAB’s work with leading-edge applications, driven largely by artificial intelligence, remains strong. On the other hand, trailing-edge technologies tied to consumer electronics, industrial, and autos have been mired in a downcycle, though those end markets are showing some early signs of a recovery. As that segment rebounds while new semiconductor design activity continues to be robust, Photronics is well-positioned to reap the benefits of several years of growth investments in China, Taiwan, Europe, and the U.S. Giving us added confidence: Management recently implemented a $100 million share repurchase program, $72 million of which was executed earlier this year.

Yet at $18 a share, the company is trading at less than 10x 2026 earnings forecasts. That represents a significant discount to peers like Cohu and Kulicke & Soffa, which are each trading at P/E multiples in excess of 25x. We believe the stock is worth $28 a share, which is 1.7x our 2026 sales estimate for PLAB and 5x 2026 EBITDA.

Dentsply Sirona, Inc. (XRAY) is another small cap that happens to be an industry leader. The result of the merger of Dentsply International and Sirona Dental Systems nearly a decade ago, XRAY is a $13.3 billion company that is one of the world’s biggest suppliers of dental equipment and supplies, including consumables, lab products, and orthodontics and implants. 

For more than two years, management has been laying the groundwork for a turnaround. Those efforts have yet to be reflected in the stock price, as the company continues to course correct from poor decisions made by prior leadership. XRAY’s efforts have been hampered by sluggish global economic growth, as the company’s largest geography, the European Union, has been stalled in a dental recession for the past three years. XRAY’s U.S. implant business, meanwhile, also continues to struggle, though there are some early signs of improved performance ahead.

For example, Dentsply’s Q1 results — including its Orthodontic and Implact Solutions segment — beat analyst expectations for revenues and earnings. The company isn’t out of the woods, but this was a significant step forward for a stock that has been pricing in worst-case scenarios in recent months. We continue to support the CEO’s pragmatic, customer-focused approach to improving market share in key areas and implementing self-help strategies to improve XRAY’s operational and strategic efficiencies. 

In addition to meeting its commitments on earnings, margin, and free cash flow improvements, management has been accelerating new product launches and finding success in centralizing storage and access of patient data on its DS Core cloud-based platform. Yet the stock remains discounted, trading at just 7X estimated Enterprise Value/EBITDA.

Outlook

As patient, long-term investors, we’ve been content to take what the market has been giving as others have ping-ponged from quarter to quarter between greed and fear. Our approach has paid off in recent years, and we believe it will only get better as the opportunity set for small caps is poised to expand as the fundamentals improve. For active, value mangers like us, this is an exciting time, as we believe this is an environment where thorough research, sound security selection, and process discipline will guide performance — as it has for Heartland over the past 40+ years.
 
Thank you for your trust,
The Heartland Investment Team

Please wait while we gather your results.

Portfolio Management Team

Heartland Advisors Value Investing Portfolio Manager Will Nasgovitz

Will Nasgovitz

CEO and Portfolio Manager

Heartland Advisors Value Investing Portfolio Manager Bill Nasgovitz

Bill Nasgovitz

Chairman and Portfolio Manager

Heartland Advisors Value Investing Research Analyst Michael Warecki

Michael Warecki

Associate Portfolio Manager

Heartland Advisors Value Investing Associate Portfolio Manager Jacob Westphal

Jacob Westphal

Associate Portfolio Manager

Composite Returns*

Scroll over to view complete data

Source: FactSet Research Systems Inc., Russell Investment Group, and Heartland Advisors, Inc.
*Yearly and quarterly returns are not annualized. The Strategy's inception date is 10/1/1988. 
**Shown as supplemental information. 

The US Dollar is the currency used to express performance. Returns are presented net of advisory fees and net of bundled fees and include the reinvestment of all income. The returns net of bundled fees were calculated by subtracting the highest applicable sponsor portion of the separately managed wrap account fee from the net of advisor fees return.

Small Cap Value Strategy Quick Links

Factsheet


Download PDF

Commentary


View Commentary

Attribution & Contribution Reports

Sign In

Holdings


Sign In


Email Sign Up


©2025 Heartland Advisors | 790 N. Water Street, Suite 1200, Milwaukee, WI 53202 | Business Office: 414-347-7777 | Financial Professionals: 888-505-5180 | Individual Investors: 800-432-7856

Past performance does not guarantee future results.

The Small Cap Value Strategy seeks long-term capital appreciation by investing in micro- and small-cap companies, generally with market capitalizations of less than the largest companies in the Russell 2000 Value Index, at the time of purchase. The micro- and small-cap segment of the stock market is robust with thousands of publicly traded issues, many of which lack traditional Wall Street research coverage. Thus, we believe this market is often inefficient, mispricing businesses and offering opportunities for fundamental research-minded investors such as Heartland.

The Small Cap Value Strategy invests in small companies selected on a value basis. Such securities generally are more volatile and less liquid than those of larger companies.

Value investments are subject to the risk that their intrinsic values may not be recognized by the broader market. 

Heartland Advisors, Inc. (the “Firm”) claims compliance with the Global Investment Performance Standards (GIPS®). The Firm is a wholly owned subsidiary of Heartland Holdings, Inc. and is registered with the Securities and Exchange Commission. For a complete list and description of Heartland Advisors composites and/or a presentation that adheres to the GIPS® standards, contact Institutional Sales at Heartland Advisors, Inc. at the address listed below.

Composite statistics and holdings are based on 6/30/2025 composite members’ account data as of 6/30/2025. Not all accounts in the strategy are included in the composite.

As of 6/30/2025, Heartland Advisors on behalf of its clients held approximately represented 0.81% and 0.77% of the total shares outstanding of Photronics, Inc. (PLAB) and Dentsply Sirona, Inc. (XRAY), respectively.  Cohu, Inc. (COHU) and Kulicke & Soffa Ind Inc (KLIC) are unowned by Heartland Advisors, Inc.

The future performance of any specific investment or strategy (including the investments discussed above) should not be assumed to be profitable or equal to past results. The performance of the holdings discussed above may have been the result of unique market circumstances that are no longer relevant. The holdings identified above do not represent all of the securities purchased, sold or recommended for the Advisor’s clients.

Portfolio holdings are subject to change. Current and future portfolio holdings are subject to risk.

Statements regarding securities are not recommendations to buy or sell.

In certain cases, dividends and earnings are reinvested.

GIPS® is a registered trademark of CFA Institute. CFA Institute does not endorse or promote this organization, nor does it warrant the accuracy or quality of the content contained herein.

Separately managed accounts and related investment advisory services are provided by Heartland Advisors, Inc., a federally registered investment advisor. ALPS Distributors, Inc., is not affiliated with Heartland Advisors, Inc.

The statements and opinions expressed in this article are those of the presenter(s). Any discussion of investments and investment strategies represents the presenters’ views as of the date created and are subject to change without notice. The opinions expressed are for general information only and are not intended to provide specific advice or recommendations for any individual. The specific securities discussed, which are intended to illustrate the advisor’s investment style, do not represent all of the securities purchased, sold, or recommended by the advisor for client accounts, and the reader should not assume that an investment in these securities was or would be profitable in the future. Certain security valuations and forward estimates are based on Heartland Advisors’ calculations. Any forecasts may not prove to be true. 

Economic predictions are based on estimates and are subject to change.

There is no guarantee that a particular investment strategy will be successful.

Sector and Industry classifications are sourced from GICS®.The Global Industry Classification Standard (GICS®) is the exclusive intellectual property of MSCI Inc. (MSCI) and S&P Global Market Intelligence (“S&P”).  Neither MSCI, S&P, their affiliates, nor any of their third party providers (“GICS Parties”) makes any representations or warranties, express or implied, with respect to GICS or the results to be obtained by the use thereof, and expressly disclaim all warranties, including warranties of accuracy, completeness, merchantability and fitness for a particular purpose.  The GICS Parties shall not have any liability for any direct, indirect, special, punitive, consequential or any other damages (including lost profits) even if notified of such damages.

Heartland Advisors defines market cap ranges by the following indices: micro-cap by the Russell Microcap®, small-cap by the Russell 2000®, mid-cap by the Russell Midcap®, large-cap by the Russell Top 200®.

Because of ongoing market volatility, performance may be subject to substantial short-term changes.

Dividends are not guaranteed and a company’s future ability to pay dividends may be limited. A company currently paying dividends may cease paying dividends at any time.

There is no assurance that dividend-paying stocks will mitigate volatility.

Russell Investment Group is the source and owner of the trademarks, service marks and copyrights related to the Russell Indices. Russell® is a trademark of the Frank Russell Investment Group.

Data sourced from FactSet: Copyright 2025 FactSet Research Systems Inc., FactSet Fundamentals. All rights reserved.

Heartland’s investing glossary provides definitions for several terms used on this page.

Artificial intelligence (AI) is intelligence—perceiving, synthesizing, and inferring information—demonstrated by computers, as opposed to intelligence displayed by humans or by other animals. Russell Investment Group is the source and owner of the trademarks, service marks and copyrights related to the Russell Indices. Russell® is a trademark of the Russell Investment Group. Earnings Before Interest, Taxes, Depreciation and Amortization (EBITDA) measures a company’s financial performance. It is used to analyze and compare profitability between companies and industries because it eliminates the effects of financing and accounting decisions. Enterprise Value/Earnings Before Interest, Taxes, Depreciation, and Amortization (EV/EBITDA) Ratio is a financial indicator used to determine the value of a company and is calculated by dividing the entire economic value of the company (enterprise value) by its earnings before interest, taxes, depreciation, and amortization (EBITDA). Free Cash Flow is the amount of cash a company has after expenses, debt service, capital expenditures, and dividends. The higher the free cash flow, the stronger the company’s balance sheet. Price/Earnings Ratio of a stock is calculated by dividing the current price of the stock by its trailing or its forward 12 months’ earnings per share. Russell 2000® Index includes the 2000 firms from the Russell 3000® Index with the smallest market capitalizations. All indices are unmanaged. It is not possible to invest directly in an index. Russell 2000® Value Index measures the performance of those Russell 2000® companies with lower price/book ratios and lower forecasted growth characteristics. S&P 500 Index is an index of 500 U.S. stocks chosen for market size, liquidity and industry group representation and is a widely used U.S. equity benchmark. All indices are unmanaged. It is not possible to invest directly in an index. The S&P 600 Chemicals Index is a stock market index that tracks the performance of chemical companies in the S&P 500 stock market index. Volatility is a statistical measure of the dispersion of returns for a given security or market index which can either be measured by using the standard deviation or variance between returns from that same security or market index. Commonly, the higher the volatility, the riskier the security. Yield Curve is a line that plots the interest rates, at a set point in time, of bonds having equal credit quality, but differing maturity dates. In a positive-sloping yield curve, short-term debt instruments have a lower yield than long-term debt instruments of the same credit quality. A negative, or inverted, yield curve occurs when short-term debt instruments have a higher yield than long-term debt instruments of the same credit quality. 10 Principles of Value Investing™ consist of the following criteria for selecting securities: (1) catalyst for recognition; (2) low price in relation to earnings; (3) low price in relation to cash flow; (4) low price in relation to book value; (5) financial soundness; (6) positive earnings dynamics; (7) sound business strategy; (8) capable management and insider ownership; (9) value of company; and (10) positive technical analysis.

top