“Those who cannot remember the past are condemned to repeat it.”
— George Santayana
Small caps outperformed large stocks by a wide margin at the start of the year, as AI-skepticism crept in and the outlook for the broader market improved. Then the war in Iran began and redirected investors’ attention in March back to bigger companies that were perceived as safe havens, raising the question: Which of these trends is the new normal?
While no one can say with absolute certainty, we’re reminded of the famous words of the philosopher and writer George Santayana, who warned of the perils of ignoring the lessons of history. The most important takeaway here is that all markets inevitably change. Every boom that has exalted a very narrow group of companies—from the ‘Nifty 50’ era in the 1970s to the dotcom bubble in the late ‘90s to the recent mega-cap tech rally driven by AI—has eventually come to an end. Over time, one way or another, the equity market has broadened out.
That began to take place over the past several months and we don’t believe rising geopolitical risks have derailed the long-term rotation into small and value. This shift is just getting started, based on a host of factors including improving fundamentals and historically attractive valuations. While the Russell 3000® Index trades at 17.5 times next year’s estimated earnings, our portfolio’s multiple is just 11.3X. Here’s another way to think about it: The value of the Russell 2000® Value Index is $1.5 trillion. That’s a mere 62% of Alphabet’s market capitalization and 50% of Nvidia’s. Small stocks aren’t just undervalued, they’re under-owned by institutions, individuals, and even foreign investors.
If the flight to safety persists in the short run, value stocks will likely come under pressure. But history tells us eventually, this part of the market should bounce back and outperform as risk aversion dissipates. Consider the chart below, which tracks the historic performance of the Russell 2000® Value Index relative to the Russell 2000® Growth benchmark against commodity prices. As you can see, past oil shocks have hurt small value initially. But over the long run, rising commodity prices have traditionally benefited this group as opportunities were uncovered and risk appetite normalized.
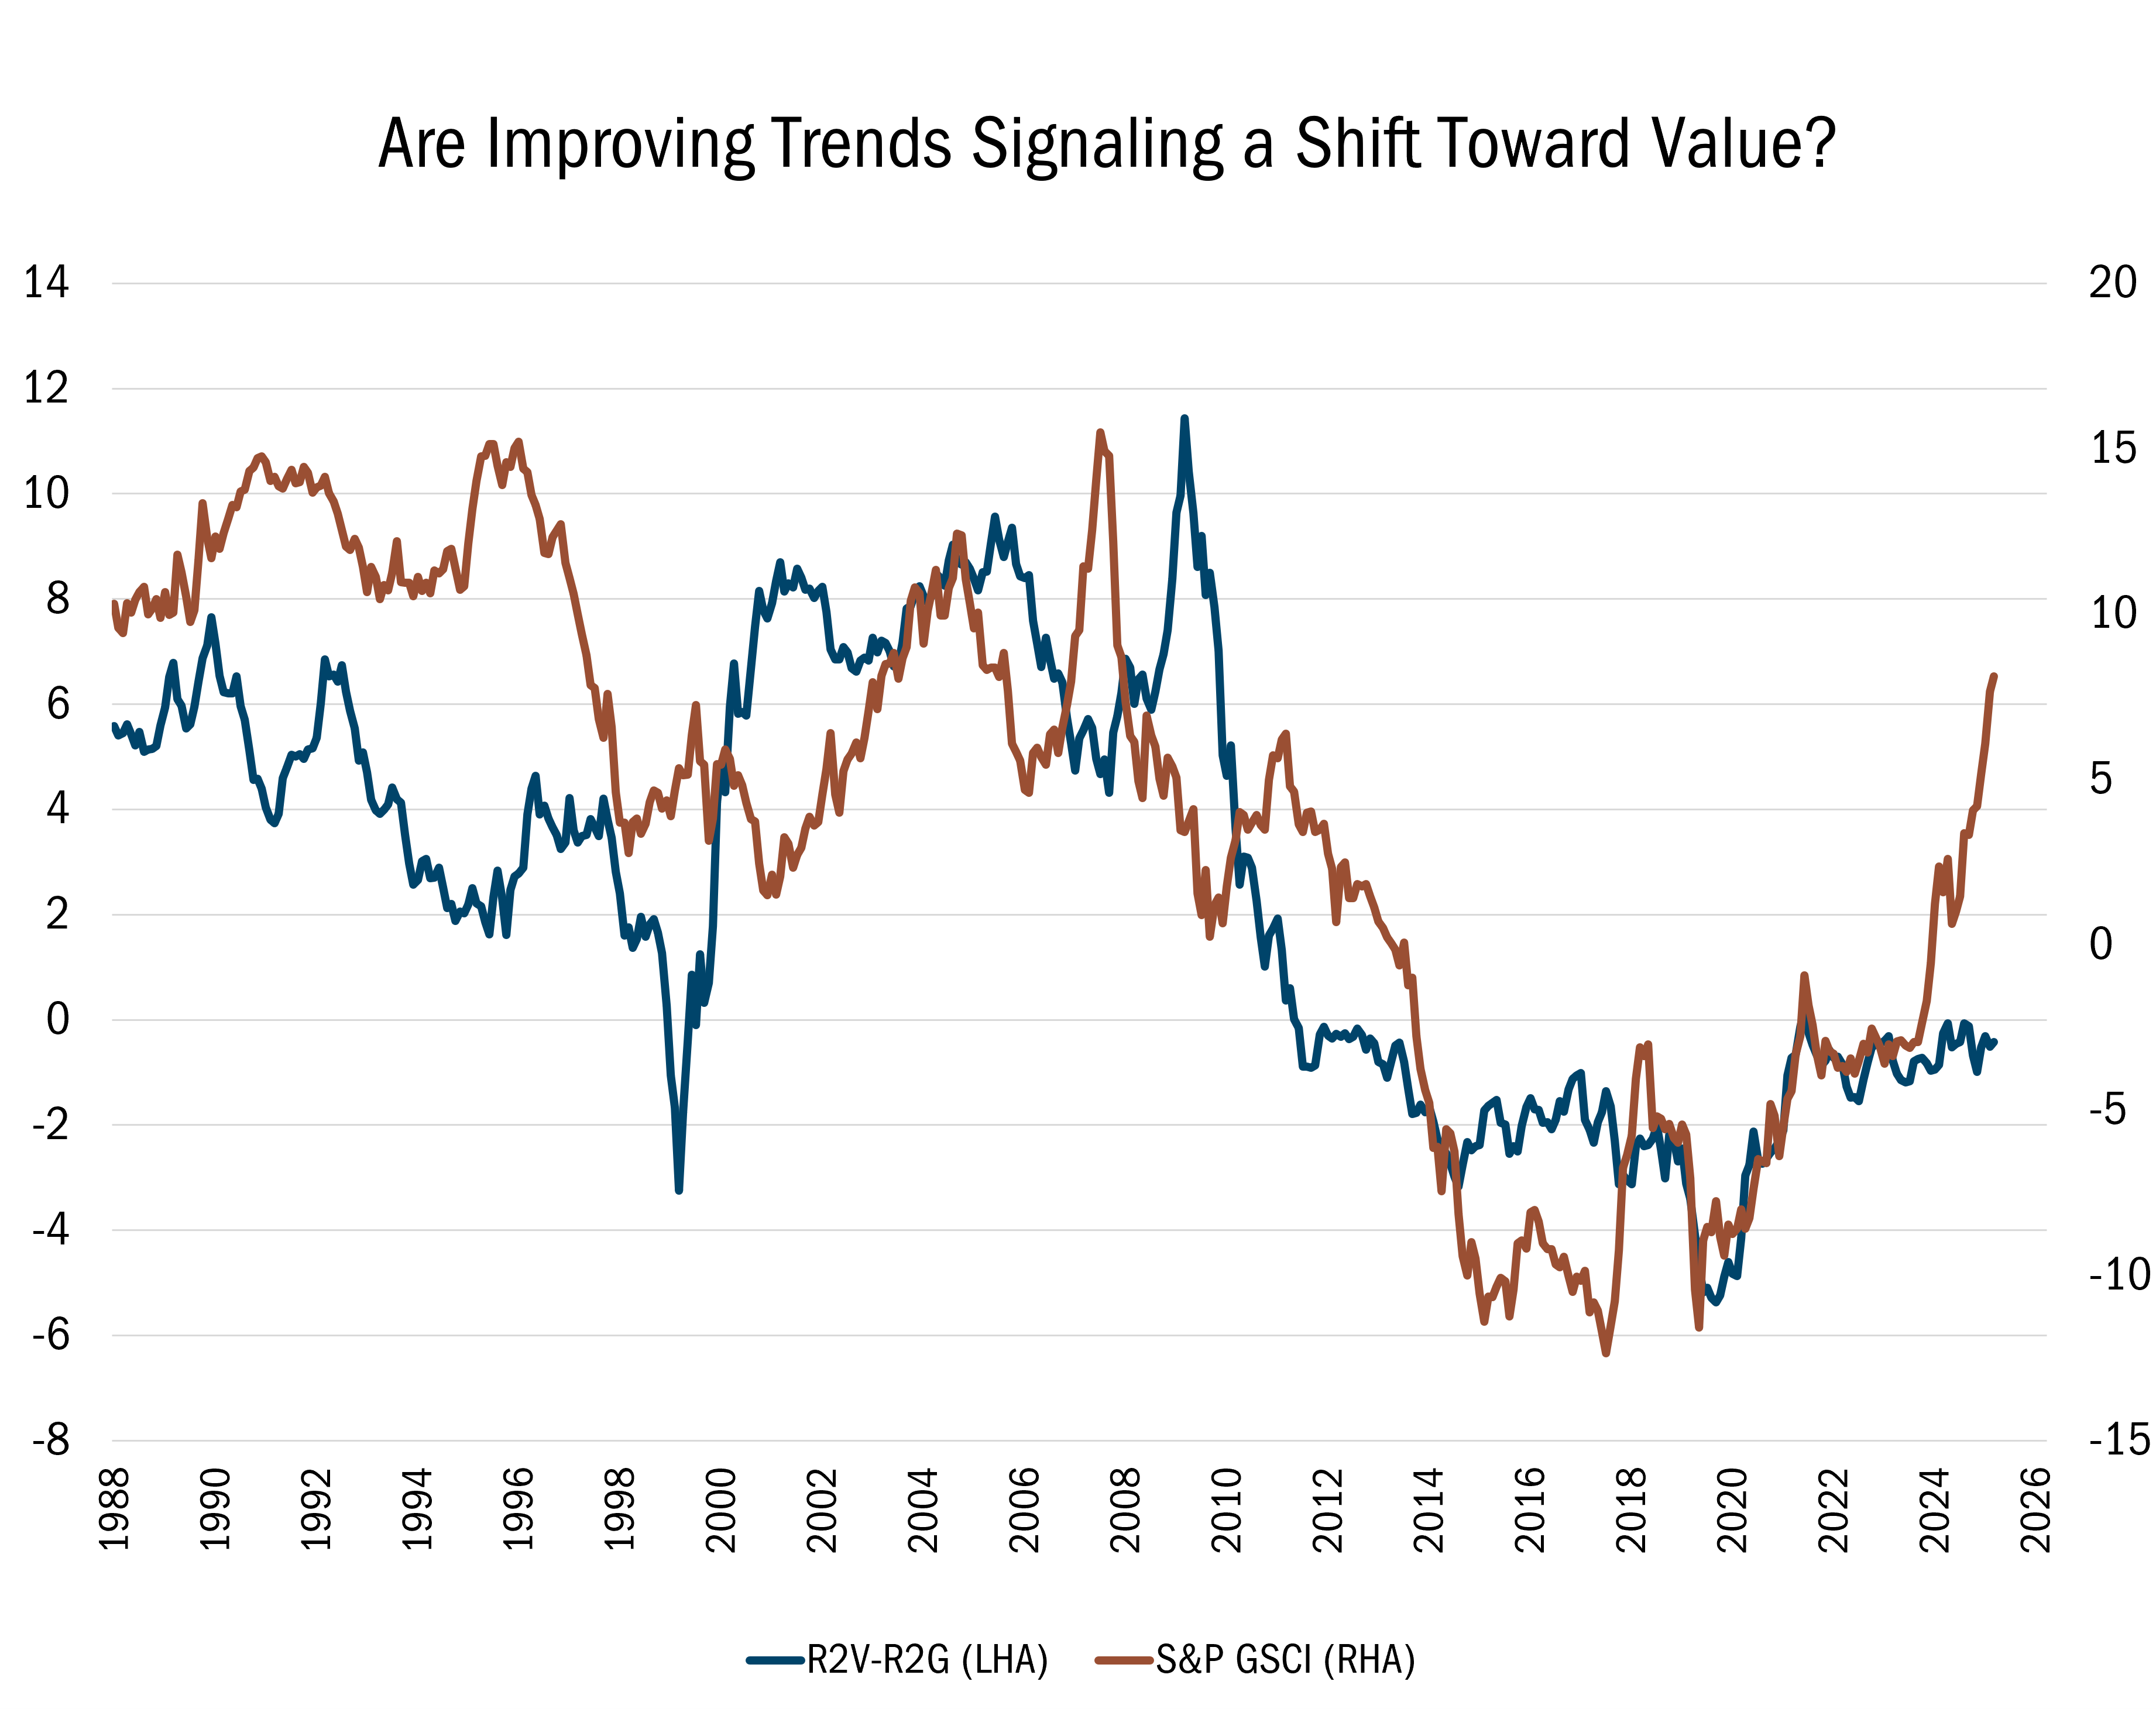
Source: FactSet Research Systems Inc. Monthly data 12/31/1988 to 2/28/2026. The data in this chart shows the relationship between commodity cycles and the relative performance of the Russell 2000® Value Index verses the Russell 2000 Growth Index stocks over time. Russell 2000® Value Index measures the performance of those Russell 2000® companies with lower price/book ratios and lower forecasted growth characteristics. Russell 2000® Growth Index measures the performance of those Russell 2000® companies with higher price/book ratios and higher forecasted growth characteristics. The S&P GSCI (formerly Goldman Sachs Commodity Index) is a premier, production-weighted benchmark for the global commodity market, measuring performance through liquid futures contracts. It provides investors with broad, diversified exposure, covering energy, industrial metals, agriculture, livestock, and precious metals, with significant weighting often placed on energy products. All indices are unmanaged. It is not possible to invest in an index. Past performance does not guarantee future results.
This gives us confidence about the long-term prospects ahead for small value. So, too, does the fact that our holdings are increasingly being viewed as takeout targets by the private markets and other publicly traded companies. We’re heartened to see other investors are finally appreciating what we’ve known all along—the attractive valuations for the businesses in our portfolio.
During the first quarter, for example, Calavo Growers (CVGW), a marketer and distributor of avocados and guacamole, agreed to be acquired by its biggest publicly owned rival. We began to accumulate shares of this company in early 2025, which we have previously highlighted as an example of the types of stocks our process identifies. That was shortly after its long-time former CEO returned to stabilize operations. Prior to that, the company endured a prolonged period of mismanagement under several chief executives.
At Heartland, our security selection system is guided by our 10 Principles of Value Investing™, and one of those precepts directs us to companies with capable management and insider ownership. Calavo showed how important effective management can be for creating shareholder value, as evidenced by our brief but fruitful investment in the stock.
Another holding that was taken out in Q1 was SunOpta (STKL). Late last year, we added to our exposure to this leading plant-based milk producer after a few key customers accelerated their supply decisions, forcing management to reset earnings expectations, which sent the shares plummeting. We thought the market overreacted and were encouraged by strong insider buying. This patience paid off, and the stock was one of the contributors to our performance at the start of the year.
These are just two examples of how our 10 Principles of Value Investing™ have served us and our clients well for more than four decades. We’re confident that its focus on fundamental factors such as low valuations, high-quality balance sheets, and positive earnings dynamics will continue to set us up for success in the current market and beyond.
In the first quarter, the Heartland Value Fund gained 7.46%, compared with the 4.96% return for the Russell 2000® Value Index. The Strategy outperformed its benchmark over the past three months, as it has over the past one, three, five, and 10 years.
Stock picking accounted for most of our outperformance, as has been the case over the past one, three, and five years. Our selection effect was negative in only three sectors during the quarter: Energy, Industrials, and Utilities. Moreover, it turned positive in Health Care, which had been a challenging group for us late last year, thanks in part to a handful of new positions in the sector.
During the quarter, we continued to remix within sectors, taking gains in winners and reallocating to new ideas where we see attractive risk/reward factors. For example, two of our real estate investment trust holdings, were acquired by private buyers. This allowed us to redistribute funds from names where much of the gains had already been realized into other REITs with strong potential catalysts for recognition and identifiable upside.
When identifying companies that fit our process, it is important that management demonstrate the ability to course correct, even if they have hit certain hurdles in the past. Case in point: Allegiant (ALGT). We initiated a position in the ultra low cost airline last year, when the shares were depressed and its story was obscured by a non core hotel project that consumed capital and complicated the narrative.
The airline ultimately sold the hotel asset, took the financial hit, and refocused on the core business—a prime example of management taking its lumps and working to improve capital allocation. The stock subsequently rallied significantly from the lows, driven by this refocus, improved execution, and the carrier’s low cost model.
Allegiant is facing renewed pressure as oil and jet fuel prices climbed after the start of the war in Iran, reminding investors of the sector’s sensitivity to energy. Recently, we reallocated capital from other airline exposure into ALGT to ensure we held the name that had the most compelling risk/reward outlook, even if its story is masked by near-term macro headwinds centered on fuel costs.
This carrier enjoys a real niche, as it is focused on leisure travel and 75% of its routes do not have non-stop competition. This model has held up well during past slowdowns and fuel spikes, and we expect it will again. Yet the stock closed the quarter at $83 a share. Longer-term, we believe that the ALGT could trade at 1.75x EV/Sales, which would value the shares at more than $200.
There has been a lot of carnage in the software industry lately, on fears that AI bots will take over the business. i3 Verticals (IIIV) hasn’t been immune.
The company, which makes enterprise software for the public sector, including school payment systems, has been pressured by the broader narrative that AI will upend its software business models. Its shares have slumped to the low thirties last fall and closed the quarter at $22. In our view, this is a case where the market has over generalized the risk. For starters, i3 provides embedded software and payments solutions for niche verticals, such as school cafeteria and tuition payments systems. The retention rate for these types of contracts has historically been very high and switching vendors can be complex. Municipalities and school districts are not in the habit of frequently putting out Requests for Proposals to change systems.
Yet the company’s cash flow characteristics, sticky customer base, and potential for eventual strategic interest do not seem to be fully reflected in current valuations. We believe IIIV is worth 16x EBITDA, which would return the stock to around $32 a share. Even if it were to hit that multiple, though, it would still be trading at a steep discount to its largest peer, which trades at 19x EBITDA.
Chiron Real Estate (XRN) is another example of how important management can be to our decision-making process. This real estate investment trust manages a portfolio of medical-related real estate primarily consisting of outpatient medical and inpatient rehab.
XRN was known as Global Medical REIT when we initiated the position last year, at around the time the company named Mark Decker, Jr., as CEO. He had previously turned around another REIT we followed and moved swiftly to cut out non-core assets, expand the portfolio into better performing subsectors, and align himself with shareholders. After outlining his vision and strategy for the company, Decker personally initiated an open market purchase of over $1 million and swiftly established a share repurchase program.
The management change and insider buying was a strong positive in our view. The executive officers, directors, and employees who now collectively control 8.3% of XRN’s equity, understand how undervalued XRN is at 12x EV/EBITDA, well below the 14-17x range for most of its Healthcare REIT peers.
We believe the recent CEO buys also validate our view that the stock is priced well below the intrinsic value of Chiron’s Real Estate. The stock currently trades close to a 30% discount to analysts’ consensus estimate of NAV, and we think that gap will close as management continues to execute on its vision and strategy.
Recent volatility, sparked by geopolitical developments, may have momentarily hit pause on the rotation from mega cap tech to small value. But, in our opinion, it hasn’t done away with the fundamental case for this part of the market. If anything, we believe opportunities have only increased, and it’s our job as disciplined active managers to identify them. With over 40 years of experience, we know that times like this are precisely when to be opportunistic, not discouraged. Over the past several months, we have been using the strong performance in small value to remix and upgrade our holdings with overlooked stocks that have yet to be re-rated by investors. We will continue to do so during this recent bout of volatility, while being guided by our 10 Principles that have served us well for over four decades.
Thank you for your loyalty and continued confidence.
Fundamentally yours,
The Heartland Investment Team
3/31/2026
Scroll over to view complete data
| Since Inception (%) | 10-Year (%) | 5-Year (%) | 3-Year (%) | 1-Year (%) | YTD (%) | QTD (%) | |
|---|---|---|---|---|---|---|---|
| Value Composite (Net of Advisory Fees)** | - | 11.15 | 10.7 | 18.35 | 32.39 | 7.46 | 7.46 |
| Russell 2000® Value | - | 9.61 | 5.79 | 13.8 | 28.09 | 4.96 | 4.96 |
Source: FactSet Research Systems Inc., Russell Investment Group, and Heartland Advisors, Inc.
*Yearly and quarterly returns are not annualized. The Strategy's inception date is 12/28/1984.
**Shown as supplemental information.
The US Dollar is the currency used to express performance. Returns are presented net of advisory fees and net of bundled fees and include the reinvestment of all income. The returns net of bundled fees were calculated by subtracting the highest applicable sponsor portion of the separately managed wrap account fee from the net of advisor fees return.
©2026 Heartland Advisors | 790 N. Water Street, Suite 1200, Milwaukee, WI 53202 | Business Office: 414-347-7777 | Financial Professionals: 888-505-5180 | Individual Investors: 800-432-7856
Past performance does not guarantee future results.
The Value Strategy seeks long-term capital appreciation by investing in small- and micro-cap companies, generally with market capitalizations of less than the largest companies in the Russell 2000® Value Index, at the time of purchase. The Strategy will typically hold between 90-120 securities.
The Value Strategy invests in small and micro companies selected on a value basis. Such securities generally are more volatile and less liquid than those of larger companies.
Value investments are subject to the risk that their intrinsic values may not be recognized by the broader market.
Heartland Advisors, Inc. (the “Firm”) claims compliance with the Global Investment Performance Standards (GIPS®). The Firm is a wholly owned subsidiary of Heartland Holdings, Inc. and is registered with the Securities and Exchange Commission. For a complete list and description of Heartland Advisors composites and/or a presentation that adheres to the GIPS® standards, contact Institutional Sales at Heartland Advisors, Inc. at the address listed below.
As of 3/31/2026 Allegiant (ALGT), Calavo Growers (CVGW), Chiron Real Estate (XRN), i3 Verticals (IIIV), and SunOpta (STKL), represented 1.37%, 1.06%, 1.36%, 1.15%, and 0.67% of the Value Composite’s net assets, respectively. Alphabet, Inc. (GOOGL) and Nividia Corporation (NVDA) are unowned.
The future performance of any specific investment or strategy (including the investments discussed above) should not be assumed to be profitable or equal to past results. The performance of the holdings discussed above may have been the result of unique market circumstances that are no longer relevant. The holdings identified above do not represent all of the securities purchased, sold or recommended for the Advisor’s clients.
Portfolio holdings are subject to change. Current and future portfolio holdings are subject to risk.
In certain cases, dividends and earnings are reinvested.
GIPS® is a registered trademark of CFA Institute. CFA Institute does not endorse or promote this organization, nor does it warrant the accuracy or quality of the content contained herein.
Separately managed accounts and related investment advisory services are provided by Heartland Advisors, Inc., a federally registered investment advisor. ALPS Distributors, Inc., is not affiliated with Heartland Advisors, Inc.
The statements and opinions expressed in this article are those of the presenter(s). Any discussion of investments and investment strategies represents the presenters’ views as of the date created and are subject to change without notice. The opinions expressed are for general information only and are not intended to provide specific advice or recommendations for any individual. The specific securities discussed, which are intended to illustrate the advisor’s investment style, do not represent all of the securities purchased, sold, or recommended by the advisor for client accounts, and the reader should not assume that an investment in these securities was or would be profitable in the future. Certain security valuations and forward estimates are based on Heartland Advisors’ calculations. Any forecasts may not prove to be true.
Economic predictions are based on estimates and are subject to change.
There is no guarantee that a particular investment strategy will be successful.
Sector and Industry classifications are sourced from GICS®.The Global Industry Classification Standard (GICS®) is the exclusive intellectual property of MSCI Inc. (MSCI) and S&P Global Market Intelligence (“S&P”). Neither MSCI, S&P, their affiliates, nor any of their third party providers (“GICS Parties”) makes any representations or warranties, express or implied, with respect to GICS or the results to be obtained by the use thereof, and expressly disclaim all warranties, including warranties of accuracy, completeness, merchantability and fitness for a particular purpose. The GICS Parties shall not have any liability for any direct, indirect, special, punitive, consequential or any other damages (including lost profits) even if notified of such damages.
Heartland Advisors defines market cap ranges by the following indices: micro-cap by the Russell Microcap®, small-cap by the Russell 2000®, mid-cap by the Russell Midcap®, large-cap by the Russell Top 200®.
Because of ongoing market volatility, performance may be subject to substantial short-term changes.
Dividends are not guaranteed and a company’s future ability to pay dividends may be limited. A company currently paying dividends may cease paying dividends at any time.
There is no assurance that dividend-paying stocks will mitigate volatility.
Russell Investment Group is the source and owner of the trademarks, service marks and copyrights related to the Russell Indices. Russell® is a trademark of the Frank Russell Investment Group.
Data sourced from FactSet: Copyright 2026 FactSet Research Systems Inc., FactSet Fundamentals. All rights reserved.
Heartland’s investing glossary provides definitions for several terms used on this page.
Active Management is the use of a human element, such as a single manager, co-managers or a team of managers, to actively manage a fund's portfolio. Active managers rely on analytical research, forecasts, and their own judgment and experience in making investment decisions on what securities to buy, hold and sell. Artificial intelligence (AI) is intelligence—perceiving, synthesizing, and inferring information—demonstrated by computers, as opposed to intelligence displayed by humans or by other animals. Earnings Before Interest, Taxes, Depreciation and Amortization (EBITDA) measures a company’s financial performance. It is used to analyze and compare profitability between companies and industries because it eliminates the effects of financing and accounting decisions. Earnings Before Interest and Tax (EBIT) is an indicator of a company’s profitability, calculated as revenue minus expenses, excluding tax and interest to eliminate the effect of different capital structures and tax rates used by different companies. Enterprise Value/Earnings Before Interest, Taxes, Depreciation, and Amortization (EV/EBITDA) Ratio is a financial indicator used to determine the value of a company and is calculated by dividing the entire economic value of the company (enterprise value) by its earnings before interest, taxes, depreciation, and amortization (EBITDA). Free Cash Flow is the amount of cash a company has after expenses, debt service, capital expenditures, and dividends. The higher the free cash flow, the stronger the company’s balance sheet. Insider Buying is the purchase of a company's stock by individual directors, executives or other employees. Russell Investment Group is the source and owner of the trademarks, service marks and copyrights related to the Russell Indices. Russell® is a trademark of the Russell Investment Group. Momentum is the rate of acceleration of a security's price or trade volume. Russell 2000® Value Index measures the performance of those Russell 2000® companies with lower price/book ratios and lower forecasted growth characteristics. S&P 500 Index is an index of 500 U.S. stocks chosen for market size, liquidity and industry group representation and is a widely used U.S. equity benchmark. All indices are unmanaged. It is not possible to invest directly in an index. S&P 500 Value Index measures value stocks using three factors: the ratios of book value, earnings, and sales to price. S&P Style Indices divide the complete market capitalization of each parent index into growth and value segments. Constituents are drawn from the S&P 500. 10 Principles of Value Investing™ consist of the following criteria for selecting securities: (1) catalyst for recognition; (2) low price in relation to earnings; (3) low price in relation to cash flow; (4) low price in relation to book value; (5) financial soundness; (6) positive earnings dynamics; (7) sound business strategy; (8) capable management and insider ownership; (9) value of company; and (10) positive technical analysis.


