While AI dominated the 2025 equity market narrative, many perceived beneficiaries experienced a late fourth-quarter pullback. Despite this late volatility, overall market breadth narrowed as mega-cap stocks significantly outperformed during the first six weeks of the quarter. The Russell 2000® Index of small stocks returned 2.19% in the final three months of the year, trailing the 2.66% gain for the S&P 500.
Reflecting on 2025, we are pleased with the Strategy’s absolute performance. While we never want to underperform, we’re not surprised that keeping up with broad indices has proven challenging. Speculative investors have confidently rewarded perceived AI winners with unsustainably high valuations. Only time will tell whether fundamentals will remain strong enough for long enough to justify the excessive valuation assigned to pockets of the equity market.
Despite what appeared to be a one-way-train equity market in 2025, it’s worth noting that volatility in shares of seeming winners serves as a reminder that nobody knows which companies will be long-term winners from the proliferation of AI.
For instance, we previously owned a holding that was widely viewed as an AI leader owing to the company’s strategy to be an arms dealer of datacenter capacity. We appeared foolish for eliminating the position in August when shares rose over 40% from our exit price following the company’s second quarter earnings report in September. We sold the company because capital spending skyrocketed to a point where it was no longer generating free cash flow, a first in over thirty years. The market added more than $300 billion to its market capitalization because of a large order from OpenAI. By early December, more than $500 billion was erased from the company’s capitalization as the market began questioning how OpenAI would fund the order. By OpenAI’s own admission, it will not be profitable until 2028 at the earliest and analysts suggest 2030 may even be optimistic. To be clear, our thesis when first purchasing this company in 2016 had nothing to do with datacenters or AI. Rather, we saw an opportunity to buy an entrenched database business transitioning to a software-as-a-service business model at an attractive valuation of free cash flow and earnings.
On the other side of sentiment, Alphabet’s Google search engine was seen as at risk of disruption by OpenAI and other AI startups. In May of 2025, shares of Alphabet were trading at a 30% discount to the S&P 500, a bargain in our opinion. Not because we ‘knew’ that Alphabet was the AI winner. Rather, we viewed Alphabet as having key assets required to be a meaningful player in the AI race (consistent free cash flow, multiple 5+ billion user apps, real-time data, cloud computing infrastructure, custom application-specific semiconductors, and its own large-language model). Most importantly, the discounted valuation provided us with a margin of safety that gave us comfort in knowing that we didn’t need to be perfectly right in our assessment of the business to make money. Since May, shares of Alphabet have more than doubled.
Why is it that companies with market capitalizations measured in the hundreds of billions or multi trillions are moving with such extreme volatility? Is the market not efficient? By our count, both companies have more than thirty smart Wall Street analysts covering the companies. For this reason, it’s hard to believe the market isn’t efficient. We believe the answer lies in how little market participants ‘know’ about the future, which is inherently uncertain. When it comes to revolutionary technology, the future is more uncertain than normal. As a result, participants will act like they ‘know’ by bidding up shares of whatever company looks like the winner right now. We have not and will not play this game. Rather, we will be realistic about what is knowable, what we don’t know, and, critically, what the market is pricing in when allocating capital.
The market’s extreme reactions, and the speed with which they are taking place, illustrate how fleeting investor confidence can be. At Heartland, considering a range of possible outcomes is core to our process. Before initiating a position in any stock, we play out a variety of scenarios, reflecting how the market might value each business under different conditions. This includes a base case, a ‘blue sky’ scenario, a ‘downside’ scenario should circumstances worsen, and a ‘max downside’ case in the event of a potential shock.
Under any circumstance, we believe this approach is important for determining the realistic risk/reward proposition for securities under consideration. But it will be especially useful as the market broadens, a process that paused in the fourth quarter. For instance, while investors have been willing to look beyond mega-cap tech lately, non-earners among small-caps continue to outperform, a sign that speculation hasn’t gone away. Even within the value universe, junkier parts of the market continue to lead, even though high quality value has outperformed over the long run (see the charts below).
Source: The Leuthold Group. Monthly data from 12/31/1996 to 10/31/2025. The data in this chart shows the comparison of Quality Performance to Quality/Junky Value over time. All performance and return numbers are based on monthly rebalancing and members are equal-weighted. Value is a composite that consists of P/E, P/Sales, P/book and this factor is ranked across the largest 1500 stock universe and the cheapest quintile is considered Value. Quality is defined by 3 factors: ROE, Leverage (debt/assets) and operational (sales and earnings) stability. Then, ranked the largest 1500 US stocks by this composite 3-factor quality rank. The top quintile is high quality and bottom quintile low quality. Quality Value is defined as the cheapest stocks that are also in the top 2 quintiles of the quality rank. Junky Value is defined as the cheapest quintile stocks that are also in the bottom 3 quintiles of the quality rank. All indices are unmanaged. It is not possible to invest directly in an index. Past performance does not guarantee future results.
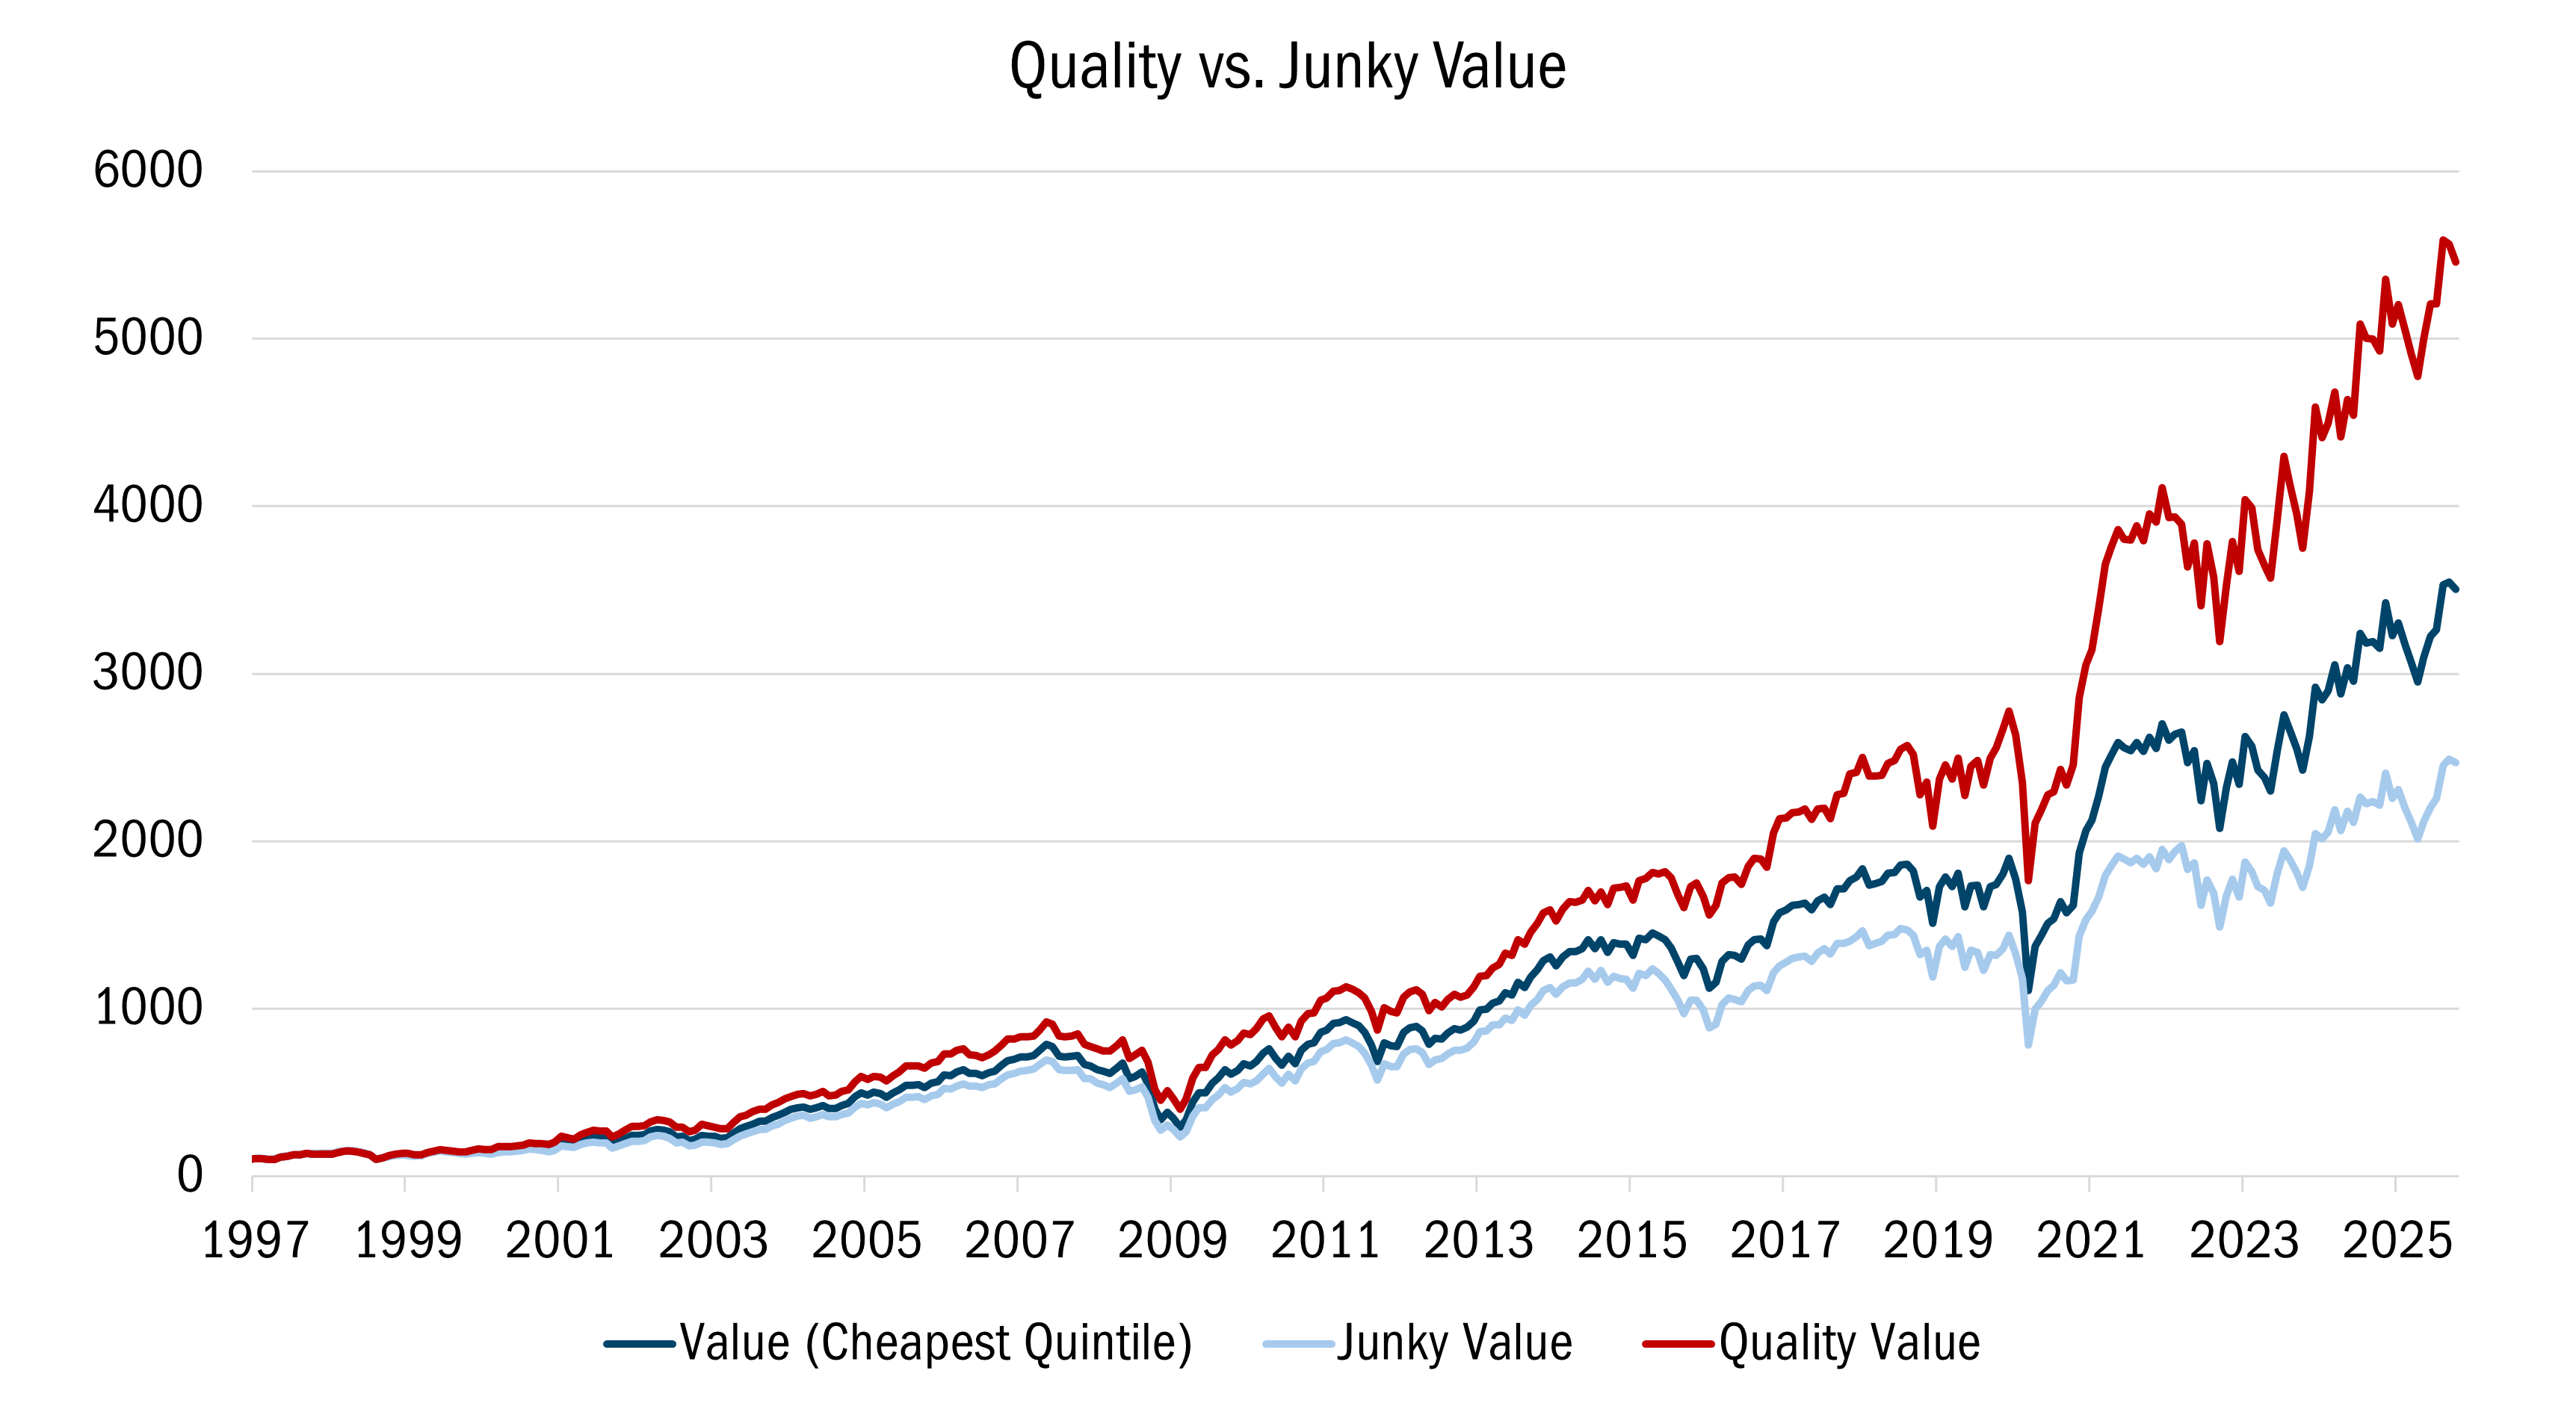
Source: The Leuthold Group. Monthly data from 12/31/1996 to 10/31/2025. The data in this chart shows the comparison of Quality Value to Junky Value over time. All performance and return numbers are based on monthly rebalancing and members are equal-weighted. Value is a composite that consists of P/E, P/Sales, P/book and this factor is ranked across the largest 1500 stock universe and the cheapest quintile is considered Value. Quality is defined by 3 factors: ROE, Leverage (debt/assets) and operational (sales and earnings) stability. Then, ranked the largest 1500 US stocks by this composite 3-factor quality rank. The top quintile is high quality and bottom quintile low quality. Quality Value is defined as the cheapest stocks that are also in the top 2 quintiles of the quality rank. Junky Value is defined as the cheapest quintile stocks that are also in the bottom 3 quintiles of the quality rank. All indices are unmanaged. It is not possible to invest directly in an index. Past performance does not guarantee future results.
As the market breadth improves, considering a variety of outcomes should help investors weigh the full range of risks. At Heartland, another way we try to control for risk is by focusing on our 10 Principles of Value Investing™, which directs us to attractively priced, financially sound, and well-managed businesses that can grow intrinsic value.
Attribution Analysis
During the quarter, our Strategy returned 0.79%, trailing the Russell 3000® Value Index, which was up 3.78%. Stock selection was mixed with 8 of the 11 underperforming, most notably Information Technology and Healthcare.
In absolute terms, the smallest stocks in our portfolio, representing companies with market caps below roughly $750 million, were our Strategy’s best performers. However, when it comes to the impact of security selection, we had the most success with mega-cap and mid-cap names, while the selection effect among small-cap was fairly neutral. Part of this goes back to the fact that many top returners in the small-cap benchmark were profitless companies, a group we generally avoid due to our adherence to the 10 Principles of Value Investing™.
Portfolio Activity
One profitable company whose shares we’ve held for years, and that demonstrates why a focus on shareholder value creation matters in the long run, is Old Republic International (ORI), a specialty property & casualty commercial insurance underwriter.
Old Republic is a classic self-help story. We initiated the position in 2019 and added to it in 2020, as the shares took a hit due to the start of the pandemic. Shortly after, ORI was transformed from an insular insurance underwriter with disparate assets to a well-run company with a management team that uses capital allocation as a lever for value creation. That was after current CEO Craig Smiddy took over the company. Prior management made a bad decision in the early 2000s by entering the mortgage insurance market.
Smiddy unwound the mortgage insurance portfolio, extracted excess capital, and returned that capital to shareholders. He and his team have proven to be admirable capital allocators. When the stock was highly discounted relative to intrinsic value, from 2022 to 2024, 20% of the company was repurchased. When the shares were more fairly valued, management authorized five special dividends over our ownership period. Cumulatively, all the dividends that ORI has issued through this time, including ordinary quarterly payouts, have totaled more than $15 a share, which is remarkable for a stock that was trading in the low-to-mid $20 range in 2019.
Looking ahead, the company should continue to grow organically by investing in new short-tail lines of business by recruiting best-in-class talent to add niche exposures with sustainable and high return potential. Managers who join ORI buy into the business over a 10-year period with ultimate payout not realized for 15 years.
The stock currently trades at roughly fair value on an absolute basis while still being at a discount relative to its larger peers. We expect the CEO to continue driving intrinsic value growth in the coming years.
A new mid-cap holding in the quarter was Prestige Consumer Healthcare (PBH), whose over-the-counter brands are familiar to many including Dramamine motion sickness relief, Clear Eyes eye drops, and CompoundW wart removal products among others. The stock had been a laggard, losing more than 30% since mid-May, thanks to supply chain issues related to its eye care business. PBH’s supplier was simply not able to ship enough products to meet demand for the company’s Clear Eyes business, causing Prestige to lose sales and lower 2025 profit guidance.
The company has since fixed this issue by acquiring that supplier for $100 million. This asset acquisition raised concerns that management was pivoting their capital allocation strategy because they had historically outsourced manufacturing to third parties. We believe the manufacturing asset purchase is a function of tight ophthalmic industry production capacity and the high regulatory hurdles that must be met to add more capacity.
The eye care business should recover as customers re-stock, and we expect the company’s 2027 earnings to accelerate now that its supply chain issues are behind it. Yet after the sell-off, PBH shares trade at less than 13 times earnings, based on consensus estimates for profits over the next 12 months. Meanwhile, the stock sports a free cash flow-to-enterprise value yield of nearly 6.5%.
A multi-year holding that has struggled recently is Watsco (WSO), the largest wholesale distributor of HVAC and refrigeration equipment in the Unites States. The company is run by father-son duo Albert (Al) and AJ Nahmad. In 1973, Al acquired a controlling stake in the company when it was a small components manufacturer. He soon pivoted the company’s strategy to distribution, and he has built a holding company that focuses on capital allocation and on building technology infrastructure that can be leveraged by their independently run business units and by the company’s HVAC contractor customers. A demand lull caused by declining new home construction activity, the weakening financial health of consumers, and the fact that demand had been pulled forward the prior year ahead of known price increases drove the stock down more than a third since February.
Why are we still attracted to this business? For starters, around 85% of its revenues are tied to the replacement of HVAC systems and components, where demand is driven by equipment failure, regardless of where we are in the economic cycle. In addition, HVAC original equipment manufacturing is a highly consolidated industry, and government efficiency standards continue to add costs to the hardware that WSO sells. This creates a backdrop where Watsco benefits from inflation in products sold. Meanwhile, its capital-light business model, where capex accounts for only around 0.5% of sales, helps to ensure that inflation won’t chip away at cash flow available for shareholder returns or growth investments.
While the market seems to be focused on short-term volume headwinds, WSO is positioned to benefit from technology investments that uniquely favor it. For example, the company has a modern tech stack and a fully digitized platform, unlike most of its peers. In recent years, management has deployed pricing optimization tools that price products based on data unique to each customer.
The company is also using AI to identify pricing outliers that can be addressed by their sales team quickly and has made investments in AI-enhanced customer service, technical support, and software development, which we believe will drive margin expansion and share gains. Meanwhile, the stock sports a free cash flow-to-enterprise value yield of around 5%, which is closer to 7% on a normalized basis. We used recent weakness in shares to increase our position in the company.
We continue to view this market opportunistically and we are well positioned for a sustained broadening of the equity market. Yet recent volatility surrounding the AI trade, and the speed with which investors have been reassessing the potential winners and losers of this theme, reinforces the importance of considering a range of potential outcomes. Our willingness to consider these ‘what ifs?’ and our 10 Principles of Value Investing™ will continue to drive our process as a new wave of opportunities — and risks — present themselves.
Thank you for your continued trust and confidence.
Scroll over to view complete data
| Since Inception (%) | 10-Year (%) | 5-Year (%) | 3-Year (%) | 1-Year (%) | YTD (%) | QTD (%) | |
|---|---|---|---|---|---|---|---|
| Opportunistic Value Equity Composite (Net of Advisory Fees)** | 9.91 | 10.12 | 11.63 | 11.66 | 8.60 | 8.60 | 1.14 |
| Opportunistic Value Equity Composite (Net of Bundled Fees) | 7.93 | 8.28 | 10.05 | 10.14 | 7.11 | 7.11 | 0.79 |
| Russell 3000® Value | 7.92 | 10.46 | 11.18 | 13.77 | 15.71 | 15.71 | 3.78 |
Source: FactSet Research Systems Inc., Russell Investment Group, and Heartland Advisors, Inc.
*Yearly and quarterly returns are not annualized. The Strategy's inception date is 9/30/1999.
**Shown as supplemental information.
The US Dollar is the currency used to express performance. Returns are presented net of advisory fees and net of bundled fees and include the reinvestment of all income. The returns net of bundled fees were calculated by subtracting the highest applicable sponsor portion of the separately managed wrap account fee from the net of advisor fees return.
©2026 Heartland Advisors | 790 N. Water Street, Suite 1200, Milwaukee, WI 53202 | Business Office: 414-347-7777 | Financial Professionals: 888-505-5180 | Individual Investors: 800-432-7856
Past performance does not guarantee future results.
In addition to stocks of large companies, the Opportunistic Value Equity Strategy invests in stocks of small- and mid-cap companies that are generally less liquid than large companies. The performance of these holdings generally will increase the volatility of the strategy’s returns.
Value investments are subject to the risk that their intrinsic value may not be recognized by the broad market.
Heartland Advisors, Inc. (the "Firm") claims compliance with the Global Investment Performance Standards (GIPS®). The Firm is a wholly owned subsidiary of Heartland Holdings, Inc., and is registered with the Securities and Exchange Commission. For a complete list and description of Heartland Advisors composites and/or a presentation that adheres to the GIPS® standards, contact the Institutional Sales Team at Heartland Advisors, Inc. at the address listed below.
As of 12/31/2025 Alphabet Inc. (Class A) (GOOGL), Old Republic International Corporation (ORI), Prestige Brands Holdings Incorporated (PBH), and Watsco Inc (WSO), represented 6.95%, 2.61%, 0.51%, and 2.16% of the Opportunistic Value Equity Composite’s net assets, respectively.
The future performance of any specific investment or strategy (including the investments discussed above) should not be assumed to be profitable or equal to past results. The performance of the holdings discussed above may have been the result of unique market circumstances that are no longer relevant. The holdings identified above do not represent all of the securities purchased, sold or recommended for the Advisor’s clients.
Statements regarding securities are not recommendations to buy or sell.
Portfolio holdings are subject to change. Current and future portfolio holdings are subject to risk.
GIPS® is a registered trademark of CFA Institute. CFA Institute does not endorse or promote this organization, nor does it warrant the accuracy or quality of the content contained herein.
Separately managed accounts and related investment advisory services are provided by Heartland Advisors, Inc., a federally registered investment advisor. ALPS Distributors, Inc., is not affiliated with Heartland Advisors, Inc.
The statements and opinions expressed in this article are those of the presenter(s). Any discussion of investments and investment strategies represents the presenters’ views as of the date created and are subject to change without notice. The opinions expressed are for general information only and are not intended to provide specific advice or recommendations for any individual. The specific securities discussed, which are intended to illustrate the advisor’s investment style, do not represent all of the securities purchased, sold, or recommended by the advisor for client accounts, and the reader should not assume that an investment in these securities was or would be profitable in the future. Certain security valuations and forward estimates are based on Heartland Advisors’ calculations. Any forecasts may not prove to be true.
Economic predictions are based on estimates and are subject to change.
There is no guarantee that a particular investment strategy will be successful.
Sector and Industry classifications are sourced from GICS®.The Global Industry Classification Standard (GICS®) is the exclusive intellectual property of MSCI Inc. (MSCI) and S&P Global Market Intelligence (“S&P”). Neither MSCI, S&P, their affiliates, nor any of their third party providers (“GICS Parties”) makes any representations or warranties, express or implied, with respect to GICS or the results to be obtained by the use thereof, and expressly disclaim all warranties, including warranties of accuracy, completeness, merchantability and fitness for a particular purpose. The GICS Parties shall not have any liability for any direct, indirect, special, punitive, consequential or any other damages (including lost profits) even if notified of such damages.
Heartland Advisors defines market cap ranges by the following indices: micro-cap by the Russell Microcap®, small-cap by the Russell 2000®, mid-cap by the Russell Midcap®, large-cap by the Russell Top 200®.
Because of ongoing market volatility, performance may be subject to substantial short-term changes.
Dividends are not guaranteed and a company’s future ability to pay dividends may be limited. A company currently paying dividends may cease paying dividends at any time.
In certain cases, dividends and earnings are reinvested.
There is no assurance that dividend-paying stocks will mitigate volatility.
CFA® is a registered trademark owned by the CFA Institute.
Russell Investment Group is the source and owner of the trademarks, service marks and copyrights related to the Russell Indices. Russell® is a trademark of the Frank Russell Investment Group.
Data sourced from FactSet: Copyright 2026 FactSet Research Systems Inc., FactSet Fundamentals. All rights reserved.
Heartland’s investing glossary provides definitions for several terms used on this page.
Artificial intelligence (AI) is intelligence perceiving, synthesizing, and inferring information—demonstrated by computers, as opposed to intelligence displayed by humans or by other animals. Beta is a measure of the sensitivity of a portfolio's rates of return against those of the market. A beta less than 1 indicates volatility less than that of the market. Cyclical Stocks cover Basic Materials, Capital Goods, Communications, Consumer Cyclical, Energy, Financial, Technology, and Transportation which tend to react to a variety of market conditions that can send them up or down and often relate to business cycles. Free Cash Flow is the amount of cash a company has after expenses, debt service, capital expenditures, and dividends. The higher the free cash flow, the stronger the company’s balance sheet. Intrinsic Value is the actual value of a company or an asset based on an underlying perception of its true value including all aspects of the business, in terms of both tangible and intangible factors. This value may or may not be the same as the current market value. Russell Investment Group is the source and owner of the trademarks, service marks and copyrights related to the Russell Indices. Russell® is a trademark of the Russell Investment Group. Russell 3000® Index is a market capitalization weighted equity index maintained by the Russell Investment Group that seeks to be a benchmark of the entire U.S. stock market and encompasses the 3,000 largest U.S.-traded stocks, in which the underlying companies are all incorporated in the U.S. All indices are unmanaged. It is not possible to invest directly in an index. Russell 3000® Value Index measures the performance of those Russell 3000® Index companies with lower price/book ratios and lower forecasted growth characteristics. Selection Effect of the Attribution Analysis is the portion of the portfolio excess return attributable to choosing different securities within groups from the benchmark. S&P 500 Index is an index of 500 U.S. stocks chosen for market size, liquidity and industry group representation and is a widely used U.S. equity benchmark. All indices are unmanaged. It is not possible to invest directly in an index. 10 Principles of Value Investing™ consist of the following criteria for selecting securities: (1) catalyst for recognition; (2) low price in relation to earnings; (3) low price in relation to cash flow; (4) low price in relation to book value; (5) financial soundness; (6) positive earnings dynamics; (7) sound business strategy; (8) capable management and insider ownership; (9) value of company; and (10) positive technical analysis.

