The more things changed in the second quarter, the more they seemed to stay the same.
At first glance, equity markets appeared to take a more defensive stance in the quarter compared with the speculation that marked the latter half of 2023 and the start of this year. This was evidenced by the fact that the two Russell 3000® Value Index sectors to post gains in Q2 were the least economically sensitive parts of the market: Consumer Staples, which was up 1.18%, and Utilities, which gained 4.51%.
Yet companies tied to popular secular themes such as AI continued to attract capital throughout the quarter. Moreover, Utilities may not have been a defensive play at all. The traditionally staid sector came to be viewed by some investors as a ‘backdoor’ way to gain exposure to the AI craze, since power companies stand to benefit from the growing need for electricity by AI technologies and data centers. And if the recent roller coaster ride in shares of GameStop is any indication, the era of speculation is by no means over. During Q2, shares of GameStop, a floundering video game retailer, shot up more than 150%, only to report a Q1 operating cash burn in excess of $100 million on a double-digit decline in revenue. Management preannounced earnings so that they could issue more than $2 billion of equity to speculators. Even after the stock fell 60% from a high in mid-May, the company is valued at around $10 billion, yet analysts forecast negative free cash flow through 2026 — simply remarkable.
While large-cap indices with significant Technology sector concentration including the S&P 500 and Nasdaq Composite shot to new record highs, the Russell Midcap®, Small-Cap®, and Large-Cap Value® indices were all down during the quarter, resulting in a further narrowing of market breadth. For example, just one stock — Nvidia (NVDA), whose chips are powering AI platforms and applications — accounted for 44% of the performance of the S&P 500 in the quarter. In fact, NVDA was responsible for virtually all the Russell 1000® Index’s gains in the past three months, despite representing less than 7% of that benchmark.
Overall, the weighting of the 10 largest stocks in the S&P 500 hasn’t been this large a percentage of the benchmark in half a century, according to Ned Davis Research (see chart below).
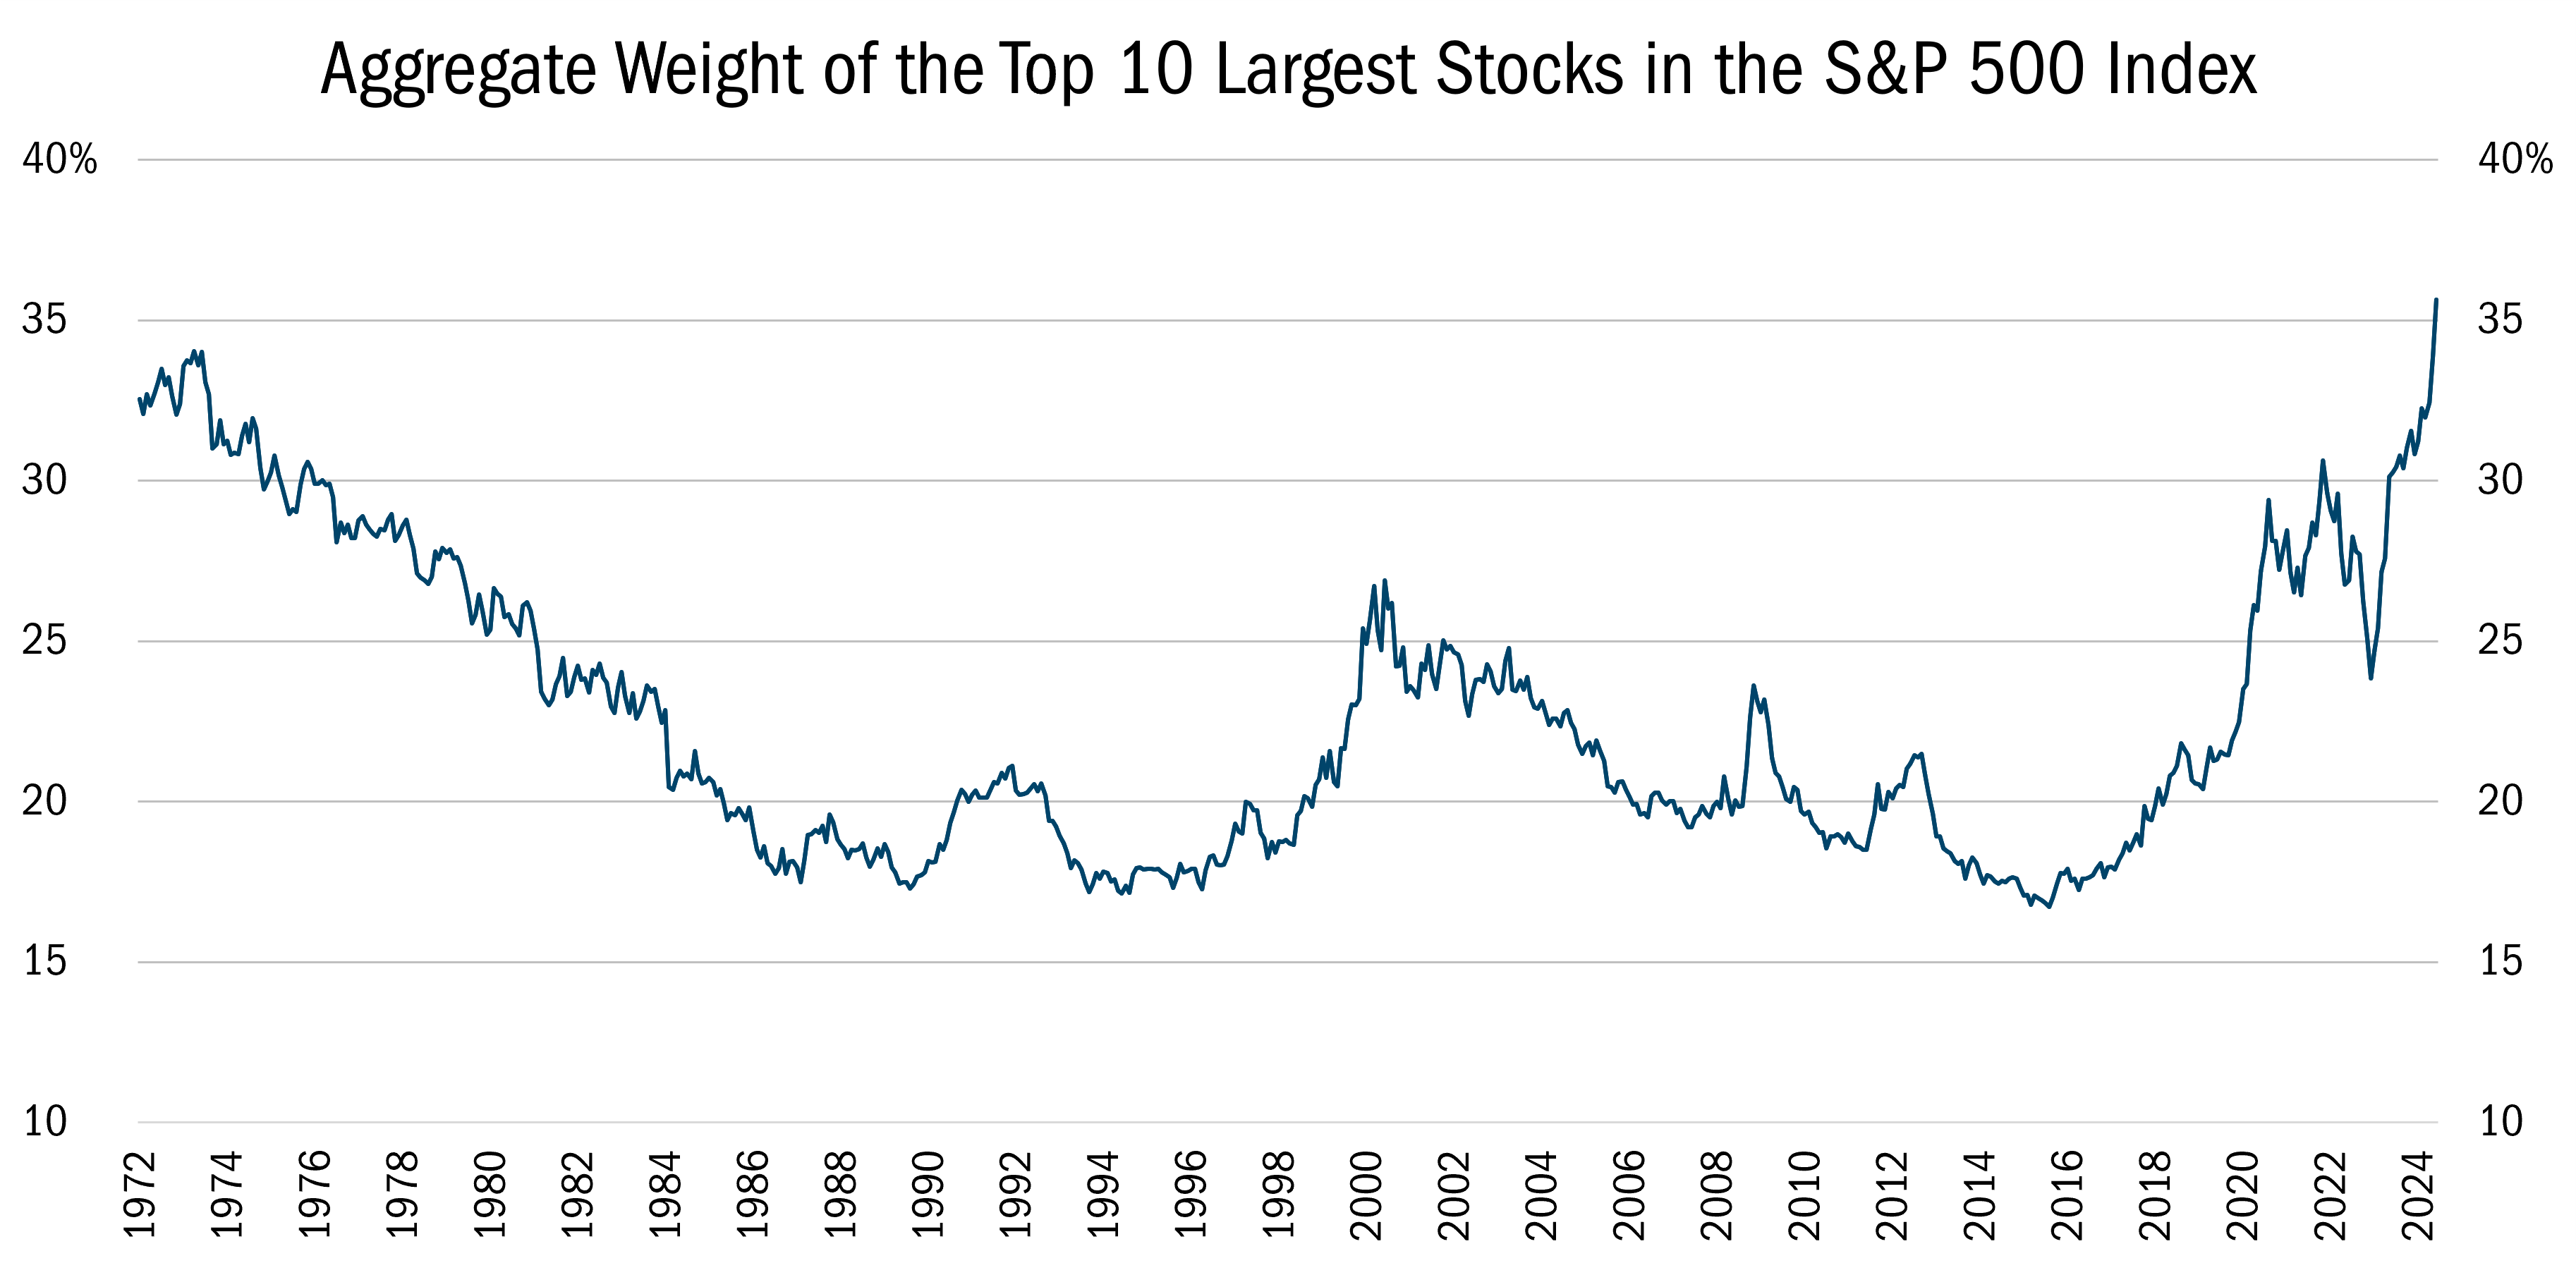
Source: Ned Davis Research, Inc. (NDR)., Monthly data from 1/31/1972 to 6/30/2024. This chart represents the percent that the largest 10 companies represent in the S&P 500 index. All indices are unmanaged. It is not possible to invest directly in an index. Past performance does not guarantee future results.
However, narrow market breadth doesn’t automatically suggest poor performance. And unlike past periods of concentration, such as the late 1990s, most mega caps haven’t risen for irrational reasons. Estimates of Nvidia’s forward earnings per share have risen six fold over the past year amid an explosion in demand for chips needed to build out AI infrastructure. That said, the market is now willing to ascribe abnormally high valuations to businesses deemed to benefit from AI and other secular themes.
We don’t seek to mimic a large-cap benchmark like the S&P 500. As value investors who can search for opportunities across market caps, we are willing to miss out on owning businesses where we don’t see an adequate margin of safety. It’s possible Nvidia’s share price may continue to soar, but we are comfortable ”missing” businesses that we can’t fully understand or where we can’t be confident that future growth and profit prospects justify its valuation. In our opinion, this discipline is what distinguishes successful long-term investors from momentum chasers.
Attribution Analysis
Our Strategy fell 2.12% in the second quarter, slightly outperforming the Russell 3000® Value Index, which posted a loss of 2.25%.
Stock selection was the primary driver of outperformance with positive stock selection in six sectors — Communications Services, Energy, Health Care, Information Technology, Materials, and Real Estate. At the same time, selection had a negative effect in four sectors — Consumer Discretionary, Financials, Industrials, and Utilities.
Though large caps continue to drive the broad market, their effect on our Strategy was mixed. Stocks in the Strategy’s top decile, based on market capitalization (greater than $30.5 billion), were the third-best contributor to our performance in the quarter, driven by strong quarterly performance by Alphabet (GOOGL) and Unilever (UL). But stocks in the middle of the cap spectrum, in Decile 5 with market values of $2.2 billion to $3.6 billion, were the best contributors to our performance on an absolute basis. That said, our overweight to smaller companies remained a drag on performance because we were underweight the largest decile, the best performing group in the benchmark, by more than twenty-three percentage points.
Portfolio Activity
We continue to see value down the market-cap spectrum, but we are also mindful that combined, small- and mid-cap stocks represent around 64% of our exposure, with large stocks making up roughly one-third ( update 6/28), which is less than half the benchmark’s weight. As a rule, we want security selection to drive our relative performance, not factor bets, including a bet on company size. While we could move more aggressively into smaller stocks in the future if circumstances and opportunities present themselves, that will be done selectively.
We construct our portfolio from a bottom-up perspective, as exemplified in the following holdings:
 Industrials. A recent small-cap addition was Brady Corporation (BRC), a Milwaukee-based maker of ID solutions such as name tags, industrial printers, and scanning equipment, along with workplace safety products such as safety signage.
Brady, with a $3.1 billion market capitalization, has spent years de-emphasizing or exiting low margin businesses that diluted profitability. As a result, BRC’s operating margin rose to a record 17% in FY 2023. That was well above the company’s 10-year median margin of below 14%. This streamlining effort resulted in tepid organic expansion and caused the stock to underperform its sector peers.
We first purchased BRC last November, and we added to that position in February. The company’s portfolio transformation is largely complete, and we believe Brady is now well positioned to focus on maintaining strong profitability and topline acceleration. Management is reinvesting some of that margin expansion into higher-margin product development, with R&D now representing 5% of sales, up from 4.5% in FY 2023 and 3.2% in FY 2016. This heightened level of spending could accelerate organic growth and surprise the market after years of anemic growth.
Meanwhile, BRC trades at roughly a 20% discount to the sector despite higher margins and a better balance sheet. We believe this gap can close as revenues rise, especially among higher-margin industrial-identification products.