What a difference a quarter makes. The mood of the market took a 180-degree turn from the end of last year, amid rising uncertainties surrounding federal policy. As fears over tariffs, spending cuts, and the cancellation of government contracts softened business and consumer confidence, volatility returned while investors braced for an economic slowdown.
The Russell Midcap® Index slumped 3.4% in the first quarter and the S&P 500 Index was down 4.3%. Value stocks outperformed growth in this environment, as rising concerns about the long-term returns on capital of artificial intelligence-related investments weighed on large tech stocks.
Though heightened volatility often strikes fear in the minds of market participants, we believe more businesses are being priced for a meaningful economic slowdown, if not a recession. We are finding opportunities to increase our exposure to parts of the market that have fallen victim to the shifting narrative. While high yield credit spreads have only begun to widen off a cyclical low, the Investors Intelligence Sentiment Index experienced a sharp drop in the percentage of investors who are bullish on the equity market, a decline on par with the COVID-19 shutdowns, the global financial crisis, and the bursting of the dotcom bubble (see the chart below).
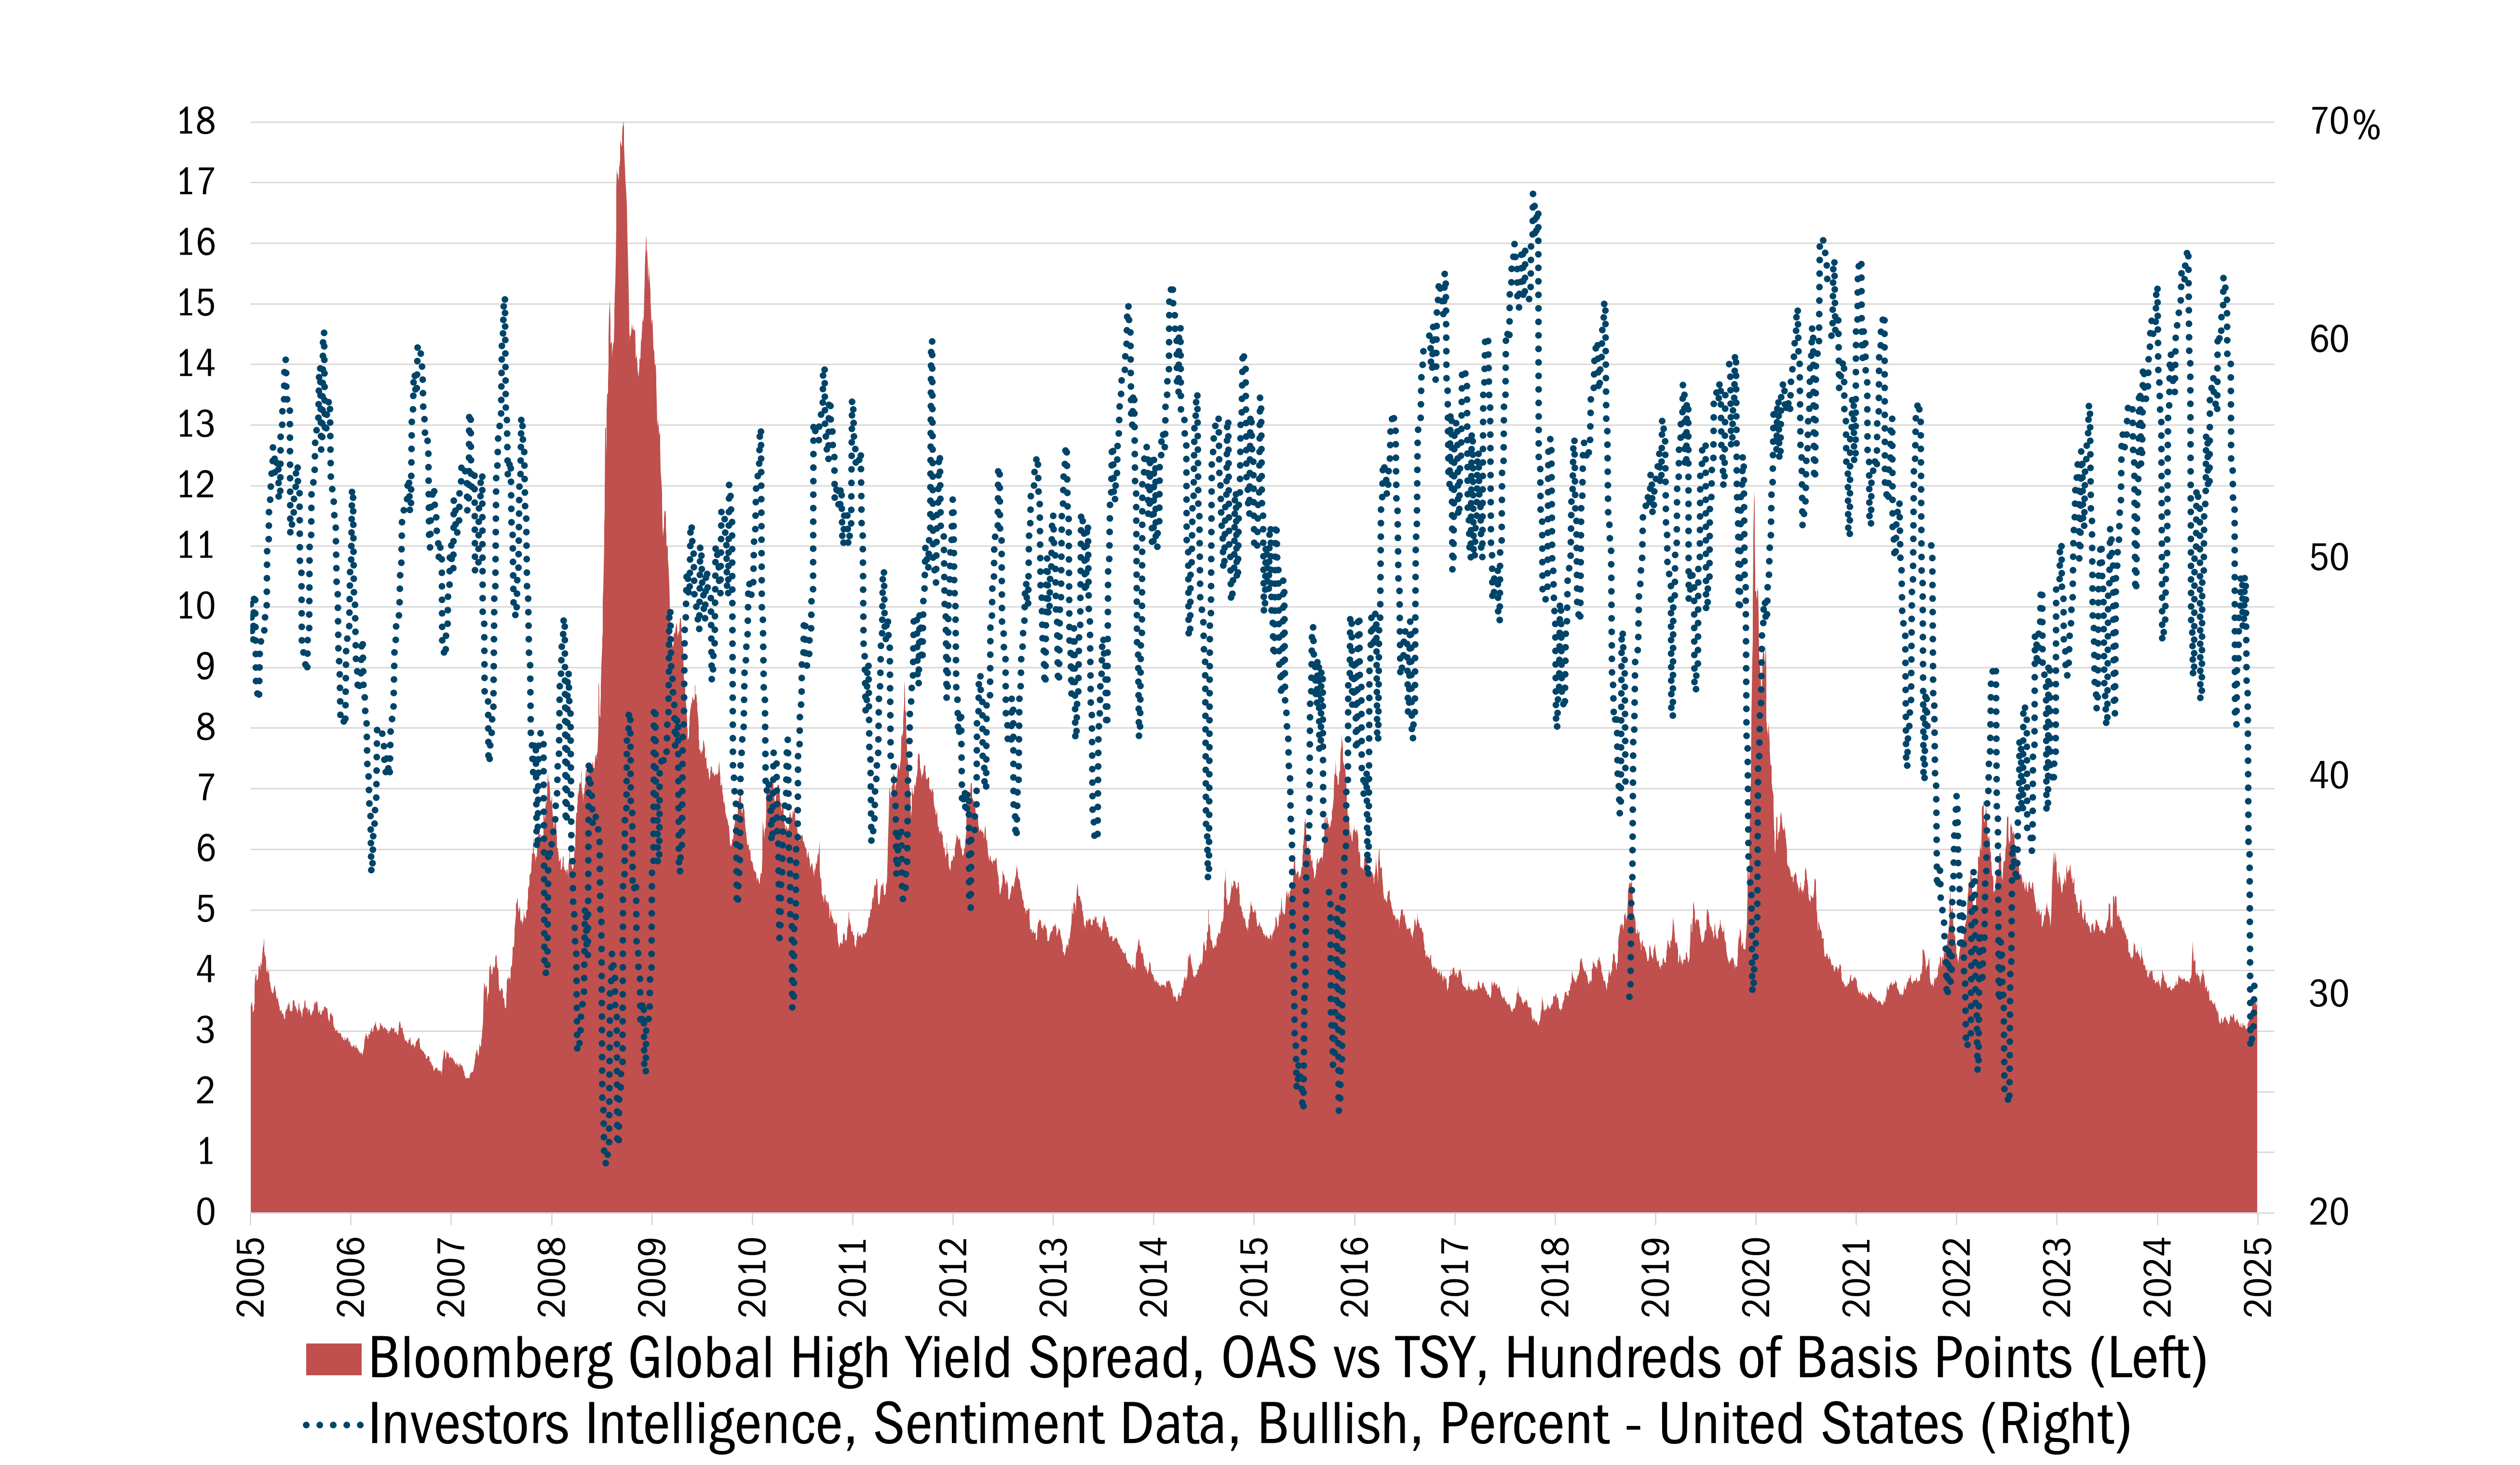
Source: Bloomberg. Daily data 3/30/2005 to 3/28/2025. This chart represents the recession periods comparing the Bloomberg Global High Yield and the Investors Intelligence Sentiment Data Percentage. The Bloomberg Global High Yield Index is a multi-currency flagship measure of the global high yield debt market. The index represents the union of the US High Yield, the Pan-European High Yield, and Emerging Markets (EM) Hard Currency High Yield Indices. The Investors Intelligence Index is a common and widely accepted means of ascertaining the balance of power between the bulls and bears. In actuality, the index may refer to one of several possible sentiment indicators, including an advisor sentiment review and an insider activity review. All indices are unmanaged. It is not possible to invest directly in an index. Past performance does not guarantee future results.
Historically, this degree of pessimism has often been a contrarian indicator that portends positive results for equities in the years to come, provided investors remain patient and avoid yesterday’s winners that, in many cases, still have significant downside potential. For us, that discipline is guided by our 10 Principles of Value Investing™, which directs our attention to attractively priced, well-managed businesses with sound finances and business strategies that can grow intrinsic value throughout market cycles.
The Mid Cap Value portfolio was up 0.73% in the first quarter, outperforming the Russell Midcap® Value Index, which fell 2.11%. Stock selection, which was challenging last year in a more speculative environment, rebounded in the quarter as risk aversion returned and a focus on downside risk was rewarded. Our selection effect was positive in eight sectors, led by Health Care, Financials, Consumer Discretionary, and Information Technology.
In addition to the 10 Principles of Value Investing™, our Strategy is built around another unique process — our two-bucket approach. At all times, we seek to hold both high-quality mid-cap companies trading at bargains (“quality value”) and deeply discounted businesses that have produced poor economic returns over time (“deep value”). We do this because each style within value investing tends to alternate market leadership, just as growth and value strategies generally take turns outperforming.
In the quarter, market volatility negatively impacted both buckets. However, many of our companies held up better than the broad market as they provided better-than-expected updates that belied their modest valuations. Our quality-value holdings rose more than 2% with notably favorable selection in Health Care and Information Technology.
While we are always on the lookout for prospective holdings in each bucket, quality-value businesses, on average, are typically fairly valued. However, in volatile markets like this, opportunities typically present themselves first in quality value. The past quarter was no exception.
![]()
Technology. Teledyne Technologies, Inc. (TDY), our largest holding, is the epitome of quality value. TDY has a well-managed, balanced portfolio of sensing and decision-support technologies across commercial and industrial end markets, including multiple secular growth areas spanning advanced machine vision, precision instrumentation, space and unmanned vehicles. TDY’s economically-sensitive customer exposure is somewhat buffered by stable markets like pollution control, water, oceanography and climate monitoring. TDY’s core markets are characterized by high barriers to entry and include niche specialized products and services unlikely to be commoditized.
In a challenging quarter for large tech stocks, Teledyne shares hit an all-time high at the start of the year, after beating consensus earnings estimates and continuing to expand profit margins despite getting little help from its challenged short-cycle end markets (where TDY has some of its highest-margin products). This helped investors imagine what earnings power could be if short-cycle markets recover.
TDY continues to execute on secular growth opportunities while demonstrating that its commercial businesses are more economically resilient than many tech-industrial peers. Despite this strong execution and the stock’s recent performance, the shares still trade at the lower end of the relative valuation premium range TDY has carried over the past decade. As we witness a “reality check” spreading across a number of companies that were trading at what we consider undeserved valuations, we think TDY’s prospects for strong relative performance remain bright.
![]()
Industrials. Another opportunity we see in quality value is The Middleby Corporation (MIDD), which designs and manufactures commercial food prep, residential kitchen, and food processing equipment. The company’s commercial foodservice segment, which makes convection ovens, blast chillers, ranges, and fryers, accounts for around 62% of sales, with the remaining 38% equally derived from its food processing and residential business, which operates under high-end brands such as Viking, Masterbuilt, and Rangemaster.
We first purchased shares of MIDD in late 2023 after the company transitioned from trading at a historic premium to industry peers to a discount despite superior profitability. We believe the derating occurred because of prior management’s decision to shift away from being a pure-play commercial equipment supplier and expand into the residential market, which is its lowest-margin and most cyclical business.
Today, management is attempting to boost margins across segments by accelerating brand integration and emphasizing higher margin products that provide enhanced productivity for customers. Until recently, the stock had not responded to these initiatives. In January, regulatory filings disclosed Ed Garden’s activist family office, Garden Investments, had built a position in MIDD. Garden is known in the investment world for co-founding Trian Fund Management alongside famed activist investor Nelson Peltz. The stock rose around 20% on the news. Since the activist news, Middleby has announced the addition of two new board members appointed by Garden, and the company is planning to spin off the food processing segment in 2026. We expect management will eventually spin or sell its low-margin residential segment as well.
Over the past 20 years, MIDD has traded at a median premium of 10% to its industrial peers. At the moment, however, its valuation stands at just 11 times EV/EBITDA over the next 12 months, a nearly 20% discount to the sector.
![]()
Healthcare. While persistent economic concerns may provide a growing list of attractive “deep value” options in cyclical companies, Perrigo Co. PLC (PRGO) is an example of heavy lifting on “self-help” bearing fruit in a company that has an economically-resilient demand profile.
The company, which enjoys a 50% share of store-branded, over-the-counter self-care and wellness products in the U.S., has stabilized its sales and pruned its line-up of low-margin items. Management plans to reinvest the healthy cash generated by this part of the business into its higher-margin, faster-growing branded lines in the U.S. and Europe. They also have a clear path, via manufacturing facility consolidation, to drive step-function improvement in the free cash flow margin of its infant formula business from low single digit to mid/high teens.
We believe self-care companies are poised to outperform and experience multiple expansion as the industry benefits from government policy and consumer preference changes. With the evolving political view of healthcare and increased interest from consumers to get and stay healthy, we are seeing a move toward preventive care and healthy aging, driving innovative new products and services such as preventive testing, personalized supplements, and food as medicine. Traditional self-care products should also see a benefit as Health and Human Services Secretary Robert F. Kennedy Jr. focuses on improved access to safe and affordable healthcare options, lowering chronic disease rates, ending childhood chronic disease, prioritizing prevention, and promoting healthy lifestyles and better nutrition.
Despite significantly improving prospects, valuations for self-care companies remain below those of consumer-packaged-goods businesses oriented toward personal care. Within self-care, we believe Perrigo is among the most attractively valued and poised to benefit as the valuation gap closes. We believe PRGO should trade at 11 times 2025 EBITDA or around 14 times earnings, which would put the stock around $40 per share, up from its current price of around $28 a share.
At the close of last year, the market was largely fixated on accelerating growth narratives, often with little regard for valuation. Today, the pendulum has swung in the opposite direction, with many companies priced for a material slowing in the business cycle. This dynamic has led to compelling valuations for a growing list of high-quality companies with strong long-term prospects, yet many investors remain hesitant.
As active value managers, our role is to look beyond short-term sentiment and identify businesses with durable competitive advantages trading at attractive prices. While volatility may persist, we remain confident in our disciplined approach, guided by our 10 Principles of Value Investing™ and our commitment to fundamental, bottom-up research. In times of uncertainty, patience and conviction often pave the way for superior long-term returns.
We appreciate your trust and look forward to capitalizing on the opportunities that lie ahead.
Scroll over to view complete data
Source: FactSet Research Systems Inc., Russell Investment Group, and Heartland Advisors, Inc.
*Yearly and quarterly returns are not annualized. The Strategy's inception date is 9/30/1996.
The US Dollar is the currency used to express performance. Returns are presented net of advisory fees and net of bundled fees and include the reinvestment of all income.
©2026 Heartland Advisors | 790 N. Water Street, Suite 1200, Milwaukee, WI 53202 | Business Office: 414-347-7777 | Financial Professionals: 888-505-5180 | Individual Investors: 800-432-7856
Past performance does not guarantee future results.
The Mid Cap Value Strategy seeks long-term capital appreciation by investing in mid-size companies as defined by the market capitalization range of the Russell Midcap® Index. This focused portfolio seeks companies with strong underlying business franchises priced at a discount to their intrinsic worth that have temporarily fallen out of favor.
The Mid Cap Value Strategy invests in mid–sized companies on a value basis. Mid-sized securities generally are more volatile and less liquid than those of larger companies.
Value investments are subject to the risk that their intrinsic value may not be recognized by the broad market.
Heartland Advisors, Inc. (the "Firm") claims compliance with the Global Investment Performance Standards (GIPS®). The Firm is a wholly owned subsidiary of Heartland Holdings, Inc., and is registered with the Securities and Exchange Commission. For a complete list and description of Heartland Advisors composites and/or a presentation that adheres to the GIPS® standards, contact the Institutional Sales Team at Heartland Advisors, Inc. at the address listed below.
As of 3/31/2025, Middleby Corporation (MIDD), Perrigo Co. PLC (PRGO), and Teledyne Technologies, Inc. (TDY), represented 1.70%, 2.11%, and 4.53% of the Mid Cap Value Composite’s net assets, respectively.
The future performance of any specific investment or strategy (including the investments discussed above) should not be assumed to be profitable or equal to past results. The performance of the holdings discussed above may have been the result of unique market circumstances that are no longer relevant. The holdings identified above do not represent all of the securities purchased, sold or recommended for the Advisor’s clients.
Statements regarding securities are not recommendations to buy or sell.
Portfolio holdings are subject to change. Current and future portfolio holdings are subject to risk.
In certain cases, dividends and earnings are reinvested.
GIPS® is a registered trademark of CFA Institute. CFA Institute does not endorse or promote this organization, nor does it warrant the accuracy or quality of the content contained herein.
Separately managed accounts and related investment advisory services are provided by Heartland Advisors, Inc., a federally registered investment advisor. ALPS Distributors, Inc., is not affiliated with Heartland Advisors, Inc.
The statements and opinions expressed in this article are those of the presenter(s). Any discussion of investments and investment strategies represents the presenters’ views as of the date created and are subject to change without notice. The opinions expressed are for general information only and are not intended to provide specific advice or recommendations for any individual. The specific securities discussed, which are intended to illustrate the advisor’s investment style, do not represent all of the securities purchased, sold, or recommended by the advisor for client accounts, and the reader should not assume that an investment in these securities was or would be profitable in the future. Certain security valuations and forward estimates are based on Heartland Advisors’ calculations. Any forecasts may not prove to be true.
Economic predictions are based on estimates and are subject to change.
There is no guarantee that a particular investment strategy will be successful.
Sector and Industry classifications are sourced from GICS®.The Global Industry Classification Standard (GICS®) is the exclusive intellectual property of MSCI Inc. (MSCI) and S&P Global Market Intelligence (“S&P”). Neither MSCI, S&P, their affiliates, nor any of their third party providers (“GICS Parties”) makes any representations or warranties, express or implied, with respect to GICS or the results to be obtained by the use thereof, and expressly disclaim all warranties, including warranties of accuracy, completeness, merchantability and fitness for a particular purpose. The GICS Parties shall not have any liability for any direct, indirect, special, punitive, consequential or any other damages (including lost profits) even if notified of such damages.
Heartland Advisors defines market cap ranges by the following indices: micro-cap by the Russell Microcap®, small-cap by the Russell 2000®, mid-cap by the Russell Midcap®, large-cap by the Russell Top 200®.
Because of ongoing market volatility, performance may be subject to substantial short-term changes.
Dividends are not guaranteed and a company’s future ability to pay dividends may be limited. A company currently paying dividends may cease paying dividends at any time.
There is no assurance that dividend-paying stocks will mitigate volatility.
CFA® is a registered trademark owned by the CFA Institute.
Russell Investment Group is the source and owner of the trademarks, service marks and copyrights related to the Russell Indices. Russell® is a trademark of the Frank Russell Investment Group.
Data sourced from FactSet: Copyright 2026 FactSet Research Systems Inc., FactSet Fundamentals. All rights reserved.
Heartland’s investing glossary provides definitions for several terms used on this page.
Bottom-up is an investment approach that de-emphasizes the significance of economic and market cycles. This approach focuses on the analysis of individual stocks and the investor focuses his or her attention on a specific company rather than on the industry in which that company operates or on the economy as a whole. Buyback is the repurchase of outstanding shares (repurchase) by a company in order to reduce the number of shares on the market. Consumer Price Index (CPI) is the most widely used measure of consumer price inflation. The CPI measures the average change over time in the prices paid by urban consumers for goods and services. The Bureau of Labor Statistics (BLS) of the U.S. Department of Labor collects the CPI price information and calculates the CPI statistics. Cyclical Stocks cover Basic Materials, Capital Goods, Communications, Consumer Cyclical, Energy, Financial, Technology, and Transportation which tend to react to a variety of market conditions that can send them up or down and often relate to business cycles. Earnings Before Interest, Taxes, Depreciation and Amortization (EBITDA) measures a company’s financial performance. It is used to analyze and compare profitability between companies and industries because it eliminates the effects of financing and accounting decisions. Enterprise Value (EV) is the entire economic value of a company. Enterprise Value/Earnings Before Interest, Taxes, Depreciation, and Amortization (EV/EBITDA) Ratio is a financial indicator used to determine the value of a company and is calculated by dividing the entire economic value of the company (enterprise value) by its earnings before interest, taxes, depreciation, and amortization (EBITDA). Federal Funds Rate is the interest rate at which a depository institution lends funds maintained at the Federal Reserve to another depository institution overnight. Free Cash Flow is the amount of cash a company has after expenses, debt service, capital expenditures, and dividends. The higher the free cash flow, the stronger the company’s balance sheet. Intrinsic Value is the actual value of a company or an asset based on an underlying perception of its true value including all aspects of the business, in terms of both tangible and intangible factors. This value may or may not be the same as the current market value. ISM Manufacturing PMI (Purchasing Managers Index) is an index based on surveys of more than 400 manufacturing firms by the Institute for Supply Management (ISM). The PMI index is an indicator of the economic health of the manufacturing sector based on five major indicators: new orders, inventory levels, production, supplier deliveries and the employment environment. A reading over 50 represents that the industry is expanding, under 50 represents a contraction, while a reading at 50 represents no change. NFIB Small Business Optimism Index is a small business optimism index compiled from a survey that is conducted each month by the National Federation of Independent Business (NFIB) of its members. The index is a composite of ten seasonally adjusted components based on questions on the following: plans to increase employment, plans to make capital outlays, plans to increase inventories, expect economy to improve, expect real sales higher, current inventory, current job opening, expected credit conditions, now a good time to expand, and earnings trend. Risk on/Risk off Theory is an investment setting in which price behavior responds to, and is driven by, changes in investor risk tolerance. Risk-on risk-off refers to changes in investment activity in response to global economic patterns. During periods when risk is perceived as low, risk-on risk-off theory states that investors tend to engage in higher-risk investments. When risk is perceived as high, investors have the tendency to gravitate toward lower-risk investments. Russell Investment Group is the source and owner of the trademarks, service marks and copyrights related to the Russell Indices. Russell® is a trademark of the Russell Investment Group. Russell Midcap® Index measures the performance of the 800 smallest companies in the Russell 1000® Index. All indices are unmanaged. It is not possible to invest directly in an index. Russell Midcap® Value Index measures the performance of those Russell Midcap® Index companies with lower price/book ratios and lower forecasted growth characteristics. All indices are unmanaged. It is not possible to invest directly in an index. Turnover is the lesser of Total Market Value of Purchases or Sales/Average Monthly Market Values. Unemployment Rate measures the number of people actively looking for a job as a percentage of the labor force. Volatility is a statistical measure of the dispersion of returns for a given security or market index which can either be measured by using the standard deviation or variance between returns from that same security or market index. Commonly, the higher the volatility, the riskier the security. 10 Principles of Value Investing™ consist of the following criteria for selecting securities: (1) catalyst for recognition; (2) low price in relation to earnings; (3) low price in relation to cash flow; (4) low price in relation to book value; (5) financial soundness; (6) positive earnings dynamics; (7) sound business strategy; (8) capable management and insider ownership; (9) value of company; and (10) positive technical analysis.


