See standardized performance at the end.
The third quarter was a challenging period for investors, as parts of the AI trade that drove the markets earlier in the year started to falter while interest rate and oil price swings created additional pressure in many pockets of the market. After enjoying double-digit percentage gains in Q2, the Russell Midcap® Index fell 1.98% over the past three months, trailing the S&P 500, which was up 2.30%.
Corporate profits for 2026 are expected to rise more than 30% for large stocks and more than 20% for mid-caps, thanks to elevated margins and the tailwinds created by the massive investment in artificial intelligence. We continue to believe artificial intelligence is a very real technology; however, history suggests that capital cycles front run technological reality, and there are clear signs of a frothy capital market as evidenced by sharp rise in public and private debt capital being raised to fund the infrastructure boom.
As the chart below shows, the rolling 10-year S&P 500 earnings growth rate now stands above the level seen in the Dotcom era and is approaching post WWII record highs.
Corporates are over-earning: one of the strongest EPS cycles in history
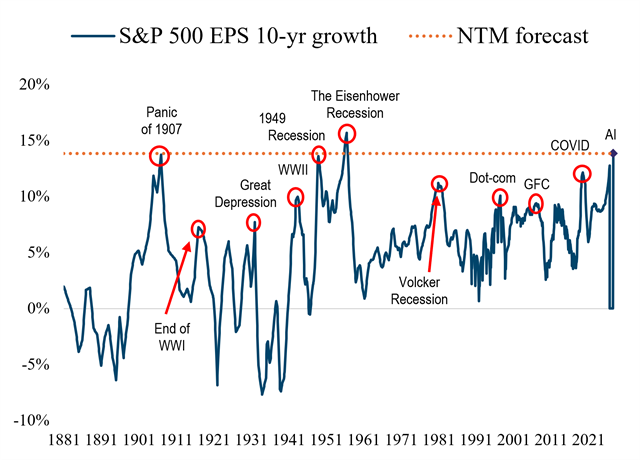
Source: Wells Fargo Securities. Monthly data from January 1881 to September 2026. This chart represents the ten-year growth rate of the S&P 500 earnings per share (EPS) compared with a long-term NTM (next-twelve-month) earnings growth forecast. Earnings Per Share is the portion of a company’s profit allocated to each outstanding share of common stock. S&P 500 Index is an index of 500 U.S. stocks chosen for market size, liquidity and industry group representation and is a widely used U.S. equity benchmark. All indices are unmanaged. It is not possible to invest directly in an index. All indices are unmanaged. It is not possible to invest in an index. Past performance does not guarantee future results.
Stepping back, fewer than ten public companies are poised to spend about $1 trillion of capital on technology infrastructure in 2026, which would boost GDP by about 3% alone. These same companies are forecasted to spend $1.3 trillion in 2027. In addition, they are signing operating leases that don’t count as capex per accounting standards, but the leases are being guaranteed by the tenant, which allows additional financing to fund the capital cycle.
In our view, many companies are ‘over-earning’ because of the front-loaded nature of the AI infrastructure cycle. Financial companies that are helping raise capital to fund AI development are getting their fees immediately. The capital raised is being deployed to manufacturers/construction companies whose products/services go into data center development. And because of the race to build out infrastructure, makers of critical parts like semiconductors and optical connectivity have realized extreme pricing power especially after considering extraordinary customer concentration, a classic indicator of weak bargaining power. Meanwhile, the negative impact on earnings seems to be delayed. For example, a hyperscaler might spend hundreds of billions of dollars in capex, but it doesn’t take depreciation charges on those investments until the data center is ready for its intended use, and the cost is recognized over time rather than all up front. In many cases, the hyperscalers are leasing significant datacenter capacity to frontier AI labs who are absorbing losses in the private market.
This does not mean the AI capex boom is certain to peak anytime soon. That said, the aggressive buildout taking place is increasingly predicated on the capital markets and on a few key assumptions including the idea that a new chip architecture won’t render existing infrastructure quickly obsolete and/or that none of the large capital spenders of today ultimately fail despite many of the top spenders generating negative free cash flow. For this reason, it’s important for investors who think like business owners to consider all possible tailwinds and headwinds that could impact a company’s cash flow, which in turn will impact their assessment of intrinsic value. This is why it’s so important to plan for a range of potential outcomes.
At Heartland, we do that by establishing four price targets for every stock we hold or consider owning, factoring in a base case, an upside scenario, a downside case, and a max downside associated with severe business stress. It’s also why fundamental research is so critical. For us, that process is driven by our 10 Principles of Value Investing™, which guides our portfolio decisions and helps direct us to companies with strong balance sheets, business models, and profit dynamics that also must be attractively priced.
As it pertains to AI, our process does not tell us to chase the next datacenter buildout play or one-time product cycle beneficiary at any price. However, as investors who respect the potential long-term implications of AI, we think our efforts are better spent assessing the opportunities and risks related to AI deployment in the “real world”. We then incorporate that into a view of long-term earnings power under a range of scenarios. The final step is comparing that range of scenarios to the current share price. Examples include companies that should capture durable profit/market share benefits from AI as well as companies with defensible attributes that are overly discounted due to a top-down AI disruption narrative. However, we also believe that many companies are potential disruption candidates in the long-run and use our process to decide what to avoid.
The Mid Cap Value Fund fell 4.77% in the third quarter, trailing the Russell Midcap® Value Index, which was down 1.98%. Stock selection was responsible for almost the entirety of that underperformance, with our negative selection effect in Technology and Health Care accounting for most of that drag.
In Health Care, our holdings did not keep up with significant rallies across biotech and life science tools, despite our position in Waters (WAT) which participated in the group strength.
In Technology, stock selection was impacted partly by the annual reconstitution of the FTSE Russell indexes, including our benchmark. In June, the rebalance led to a migration of heavily shorted, high-octane names in IT services and software into the Midcap Value Index. Many of these names, which we wouldn’t own because of our adherence to the 10 Principles, rebounded 30% to 100% in the quarter, making our comparisons difficult. We will not lose sleep “missing out” on trading opportunities in many of these business models that strike us as speculative and/or viable disruption candidates.
As for our two-bucket approach, we remain near the high end of our underweight to Deep Value, as Quality Value has underperformed on an historic scale. That said, the valuation gap within the midcap space is as wide as we can remember, creating opportunities for investors with the process to identify those stocks and the patience to exploit them.

Technology. Bentley Systems (BSY), a newly initiated position during the quarter, is an example of a stock getting heavily discounted by a negative top-down industry narrative, with defensible and compelling long-term prospects. To be clear, we are wary of the outlook for many software products, especially those that serve administrative functions and are prone to faster switching decisions in a widening competitive landscape. Our research has centered on “vertical software” companies that provide end-to-end solutions for a specific industry because domain expertise drives higher customer loyalty and switching costs.
Among the vertical software companies in our universe, we find BSY’s characteristics especially attractive from both a “moat” and opportunity perspective. The company provides engineering software for critical infrastructure around the world for public works and natural resources end markets. Over 40 years of proprietary data and deep integration has made BSY the industry standard for infrastructure modeling and simulation. Their software represents roughly five basis points (0.05%) of total project cost for mission critical infrastructure, with BSY’s engineering customers facing severe engineering labor challenges and their asset owner customers relying on BSY’s software to ensure reliability and minimize expenses while avoiding a high cost of failure. With end market demand buoyed by a need to address structural underinvestment, we expect BSY sales and free cash flow to accelerate further as customers consume more of their offerings for AI-oriented workloads.

Industrials. Sometimes, opportunities can be found inside your existing portfolio—if you have the patience to find out. Case in point: Watsco (WSO), the largest wholesale distributor of HVAC and refrigeration equipment in the U.S., which was the biggest detractor to our Fund’s performance in the quarter.
The residential HVAC industry is going through a demand lull created by a combination of factors including declining new construction activity, weakening consumer financial conditions, and a pull-forward of demand caused by a refrigerant change in 2025. Watsco and the major residential HVAC equipment manufacturers underperformed following disappointing Q2 earnings results, characterized by persistent demand weakness and margin pressure associated with a lack of volume growth and tariff-induced cost volatility.
While the market is myopically focused on short-term volume headwinds, we believe WSO is positioned to benefit from technology investments that uniquely favor the industry’s juggernaut. For example, the company has a modern tech stack and a fully digitized platform unlike most of their peers. Watsco is also using AI to optimize for demand elasticity and to identify pricing outliers that can be addressed by their sales team quickly. We believe management’s investments in AI-enhanced customer service, technical support, and software development will drive margin expansion and share gains for years to come.
Recently, Watsco announced the acquisition of two separate family-run businesses. These acquisitions should increase revenue and cash flow by roughly 10%. Given the company’s unlevered balance sheet, greater cash flow generation accrues to equity holders through an increase in intrinsic value. Yet the stock trades at a free cash flow/enterprise value yield of just 6%, based on 2027 FCF.

Financials. A recent example of our patience paying off is MarketAxess Holdings (MKTX). In July, we noted that the operator of the largest U.S. corporate bond e-trading platform was the biggest detractor to our Strategy’s performance in Q2. One of the reasons was heavy primary bond issuance volume and tighter credit spreads temporarily diverted trading volume away from MKTX's core secondary market. We remained committed to the stock for several reasons, including the fact that the company was exiting a heavy investment cycle, setting up strong operating leverage. Moreover, trading data indicated that MarketAxess was gaining market share in a key credit trading protocol where management had focused investments. In late July, the company that owns the New York Stock Exchange announced its intent to buy MKTX for $167 per share in cash.
Investors continue to react to short-term news in extreme fashion. We believe they would be better off thinking like long-term business owners. However, this can be challenging, because it’s difficult to determine the intrinsic value of a business without knowing what possible headwinds and tailwinds each company might face in the next five to ten years. This is particularly difficult when it comes to AI-related bets, because more rapid industry changes should imply less confidence in long-term forecasts. Customer bases can consolidate. Capacity can expand. Bargaining power can shift. Exceptional margins can normalize.
To us, this makes it especially important to plan for a range of possible outcomes. It also places greater emphasis on fundamental considerations such as the strength of a company’s balance sheet, its potential for earnings growth, and the price investors are willing to pay for those profits. At Heartland, we take comfort in knowing that our portfolio construction process is rooted in a disciplined process that accounts for these challenges, driven by our four price-target approach and our 10 Principles of Value Investing™.
Scroll over to view complete data
| Since Inception (%) | 20-Year (%) | 15-Year (%) | 10-Year (%) | 5-Year (%) | 3-Year (%) | 1-Year (%) | YTD* (%) | QTD* (%) | |
|---|---|---|---|---|---|---|---|---|---|
| Mid Cap Value Investor Class | 8.21 | -- | -- | 8.96 | 5.62 | 6.72 | 6.85 | 8.94 | -4.77 |
| Mid Cap Value Institutional Class | 8.48 | -- | -- | 9.22 | 5.89 | 6.95 | 7.01 | 9.12 | -4.74 |
| Russell Midcap® Value | 9.19 | 8.90 | 12.36 | 9.93 | 9.26 | 17.50 | 16.89 | 15.25 | -1.98 |
*Not annualized
Source: FactSet Research Systems Inc., Russell®, and Heartland Advisors, Inc.
The inception date for the Mid Cap Value Fund is 10/31/2014 for the investor and institutional class.
In the prospectus dated 5/1/2026, the Net Fund Operating Expenses for the investor and institutional classes of the Mid Cap Value Fund are 1.10% and 0.85%, respectively. The Advisor has contractually agreed to waive its management fees and/or reimburse expenses of the Fund to ensure that Net Fund Operating Expenses for the Fund do not exceed 1.10% of the Fund’s average net assets for the investor class shares and 0.85% for the institutional class shares, through at least 4/5/2028, and subject thereafter to annual reapproval of the agreement by the Board of Directors. Without such waiver and/or reimbursements, the Gross Fund Operating Expenses would be 1.21% for the investor class shares and 0.95% for the institutional class shares.
Past performance does not guarantee future results. Performance represents past performance; current returns may be lower or higher. Performance for institutional class shares prior to their initial offering is based on the performance of investor class shares. The investment return and principal value will fluctuate so that an investor's shares, when redeemed, may be worth more or less than the original cost. All returns reflect reinvested dividends and capital gains distributions, but do not reflect the deduction of taxes that an investor would pay on distributions or redemptions. Subject to certain exceptions, shares of a Fund redeemed or exchanged within 10 days of purchase are subject to a 2% redemption fee. Performance does not reflect this fee, which if deducted would reduce an individual's return. To obtain performance through the most recent month end, call 800-432-7856 or visit heartlandadvisors.com.


©2026 Heartland Advisors | 790 N. Water Street, Suite 1200, Milwaukee, WI 53202 | Business Office: 414-347-7777 | Financial Professionals: 888-505-5180 | Individual Investors: 800-432-7856
In the prospectus dated 5/1/2026, the Net Fund Operating Expenses for the investor and institutional classes of the Mid Cap Value Fund are 1.10% and 0.85%, respectively. The Advisor has contractually agreed to waive its management fees and/or reimburse expenses of the Fund to ensure that Net Fund Operating Expenses for the Fund do not exceed 1.10% of the Fund’s average net assets for the investor class shares and 0.85% for the institutional class shares, through at least 4/5/2028, and subject thereafter to annual reapproval of the agreement by the Board of Directors. Without such waiver and/or reimbursements, the Gross Fund Operating Expenses would be 1.21% for the investor class shares and 0.95% for the institutional class shares.
Past performance does not guarantee future results. Performance represents past performance; current returns may be lower or higher. Performance for institutional class shares prior to their initial offering is based on the performance of investor class shares. The investment return and principal value will fluctuate so that an investor's shares, when redeemed, may be worth more or less than the original cost. All returns reflect reinvested dividends and capital gains distributions, but do not reflect the deduction of taxes that an investor would pay on distributions or redemptions. Subject to certain exceptions, shares of a Fund redeemed or exchanged within 10 days of purchase are subject to a 2% redemption fee. Performance does not reflect this fee, which if deducted would reduce an individual's return. To obtain performance through the most recent month end, call 800-432-7856 or visit heartlandadvisors.com.
An investor should consider the Funds’ investment objectives, risks, and charges and expenses carefully before investing or sending money. This and other important information may be found in the Funds' prospectus. To obtain a prospectus, please call 800-432-7856 or visit heartlandadvisors.com. Please read the prospectus carefully before investing.
As of 9/30/2026, Bentley Systems Inc. (Class B) (BSY), MarketAccess Holding, Inc. (MKTX), Waters Corp. (WAT), and Watsco Inc. (WSO), represented 1.24%, 1.36%, 2.03 and 2.57% of the Mid Cap Value Fund’s net assets, respectively.
Statements regarding securities are not recommendations to buy or sell.
Portfolio holdings are subject to change. Current and future portfolio holdings are subject to risk.
The Mid Cap Value Fund invests in a smaller number of stocks (generally 40 to 60) than the average mutual fund. The performance of these holdings generally will increase the volatility of the Fund’s returns. The Fund also invests in mid-sized companies on a value basis. Mid-sized securities generally are more volatile and less liquid than those of larger companies.
Value investments are subject to the risk that their intrinsic value may not be recognized by the broad market.
The Mid Cap Value Fund seeks long-term capital appreciation and modest current income.
The Fund’s performance information included in regulatory filings includes a required index that represents an overall securities market (Regulatory Benchmark). In addition, the Fund's regulatory filings may also include an index that more closely aligns to the Fund's investment strategy (Strategy Benchmark(s)). The Fund's performance included in marketing and advertising materials and information other than regulatory filings is generally compared only to the Strategy Benchmark.
The above individuals are registered representatives of ALPS Distributors, Inc.
The Heartland Funds are distributed by ALPS Distributors, Inc.
The statements and opinions expressed in this article are those of the presenter(s). Any discussion of investments and investment strategies represents the presenters’ views as of the date created and are subject to change without notice. The opinions expressed are for general information only and are not intended to provide specific advice or recommendations for any individual. The specific securities discussed, which are intended to illustrate the advisor’s investment style, do not represent all of the securities purchased, sold, or recommended by the advisor for client accounts, and the reader should not assume that an investment in these securities was or would be profitable in the future. Certain security valuations and forward estimates are based on Heartland Advisors’ calculations. Any forecasts may not prove to be true.
Economic predictions are based on estimates and are subject to change.
There is no guarantee that a particular investment strategy will be successful.
Sector and Industry classifications are sourced from GICS®.The Global Industry Classification Standard (GICS®) is the exclusive intellectual property of MSCI Inc. (MSCI) and S&P Global Market Intelligence (“S&P”). Neither MSCI, S&P, their affiliates, nor any of their third party providers (“GICS Parties”) makes any representations or warranties, express or implied, with respect to GICS or the results to be obtained by the use thereof, and expressly disclaim all warranties, including warranties of accuracy, completeness, merchantability and fitness for a particular purpose. The GICS Parties shall not have any liability for any direct, indirect, special, punitive, consequential or any other damages (including lost profits) even if notified of such damages.
Heartland Advisors defines market cap ranges by the following indices: micro-cap by the Russell Microcap®, small-cap by the Russell 2000®, mid-cap by the Russell Midcap®, large-cap by the Russell Top 200®.
Because of ongoing market volatility, performance may be subject to substantial short-term changes.
Dividends are not guaranteed and a company’s future ability to pay dividends may be limited. A company currently paying dividends may cease paying dividends at any time.
There is no assurance that dividend-paying stocks will mitigate volatility.
CFA® is a registered trademark owned by the CFA Institute.
Russell Investment Group is the source and owner of the trademarks, service marks and copyrights related to the Russell Indices. Russell® is a trademark of the Frank Russell Investment Group.
Data sourced from FactSet: Copyright 2026 FactSet Research Systems Inc., FactSet Fundamentals. All rights reserved.
Heartland’s investing glossary provides definitions for several terms used on this page.
Artificial intelligence (AI) is intelligence—perceiving, synthesizing, and inferring information—demonstrated by computers, as opposed to intelligence displayed by humans or by other animals. Enterprise Value (EV) is the entire economic value of a company. Free Cash Flow is the amount of cash a company has after expenses, debt service, capital expenditures, and dividends. The higher the free cash flow, the stronger the company’s balance sheet. Gross Domestic Product (GDP) is the monetary value of all the finished goods and services produced within a country’s borders in a specific time period, though GDP is usually calculated on an annual basis. Intrinsic Value is the actual value of a company or an asset based on an underlying perception of its true value including all aspects of the business, in terms of both tangible and intangible factors. This value may or may not be the same as the current market value. Margin of Safety is a principle of investing in which an investor only purchases securities when the market price is significantly below its intrinsic value. Russell Investment Group is the source and owner of the trademarks, service marks and copyrights related to the Russell Indices. Russell® is a trademark of the Russell Investment Group. Russell Midcap® Index measures the performance of the 800 smallest companies in the Russell 1000® Index. All indices are unmanaged. It is not possible to invest directly in an index. Russell Midcap® Value Index measures the performance of those Russell Midcap® Index companies with lower price/book ratios and lower forecasted growth characteristics. All indices are unmanaged. It is not possible to invest directly in an index. S&P 500 Index is an index of 500 U.S. stocks chosen for market size, liquidity and industry group representation and is a widely used U.S. equity benchmark. All indices are unmanaged. It is not possible to invest directly in an index. Volatility is a statistical measure of the dispersion of returns for a given security or market index which can either be measured by using the standard deviation or variance between returns from that same security or market index. Commonly, the higher the volatility, the riskier the security. 10 Principles of Value Investing™ consist of the following criteria for selecting securities: (1) catalyst for recognition; (2) low price in relation to earnings; (3) low price in relation to cash flow; (4) low price in relation to book value; (5) financial soundness; (6) positive earnings dynamics; (7) sound business strategy; (8) capable management and insider ownership; (9) value of company; and (10) positive technical analysis.