See standardized performance at the end.
There are periods in the market when paying attention to valuations can be penalizing, and the third quarter was one of those times. We saw a continuation of trends that began accelerating in the second half of Q2. Growing optimism surrounding the AI boom and the corresponding surge in electricity demand have helped power large- and mid-cap growth stocks to new highs regardless of business model quality or valuation. Honorable mention goes to continued chasing of speculative bets on crypto currencies where a business model is not required and where leverage is treated like vegetables, the more the better. If only our children would consume vegetables like crypto “investors” crave leverage. Not owning the highest-octane cyclicals put our Strategy at a disadvantage during the quarter, as lower multiple and/or defensive parts of the market were left behind in the market’s embrace of the thematic narratives regardless of price. To be clear, we believe AI is a disruptive technology, but many current perceived “winners” could fail to live up to the hype. This has been the case with other disruptive technologies ranging from the internal combustion engine to the internet.
Over the past three months, the Russell Midcap® Index advanced 6.18% while the tech-heavy Nasdaq Composite Index gained 11.24% in the quarter. Even within our universe of stocks, we saw similar trends play out. Returns for momentum in the Russell Midcap® Value Index outpaced value factors such as free cash flow to enterprise value by more than 14% over the past 12 months.
Still, pockets of economic weakness persist, including in the residential housing market where several industry participants have recently called out deteriorating demand in new construction and remodeling activity. Even areas of historical resilience, like replacing an air conditioning unit when it fails, are exhibiting abnormal demand weakness. Affordability is a persistent issue. Several negative economic datapoints on the job market developed in September, including disappointing job creation in August coupled with a larger-than-expected downward revision to non-farm payrolls for the prior year, dropping employment estimates by almost one million jobs.
As the chart below shows, changes in the trajectory of the job market, as evidenced by initial jobless claims, tend to persist for some time. A 20% spike in unemployment claims has foreshadowed recessions and the associated drop in equity valuations.
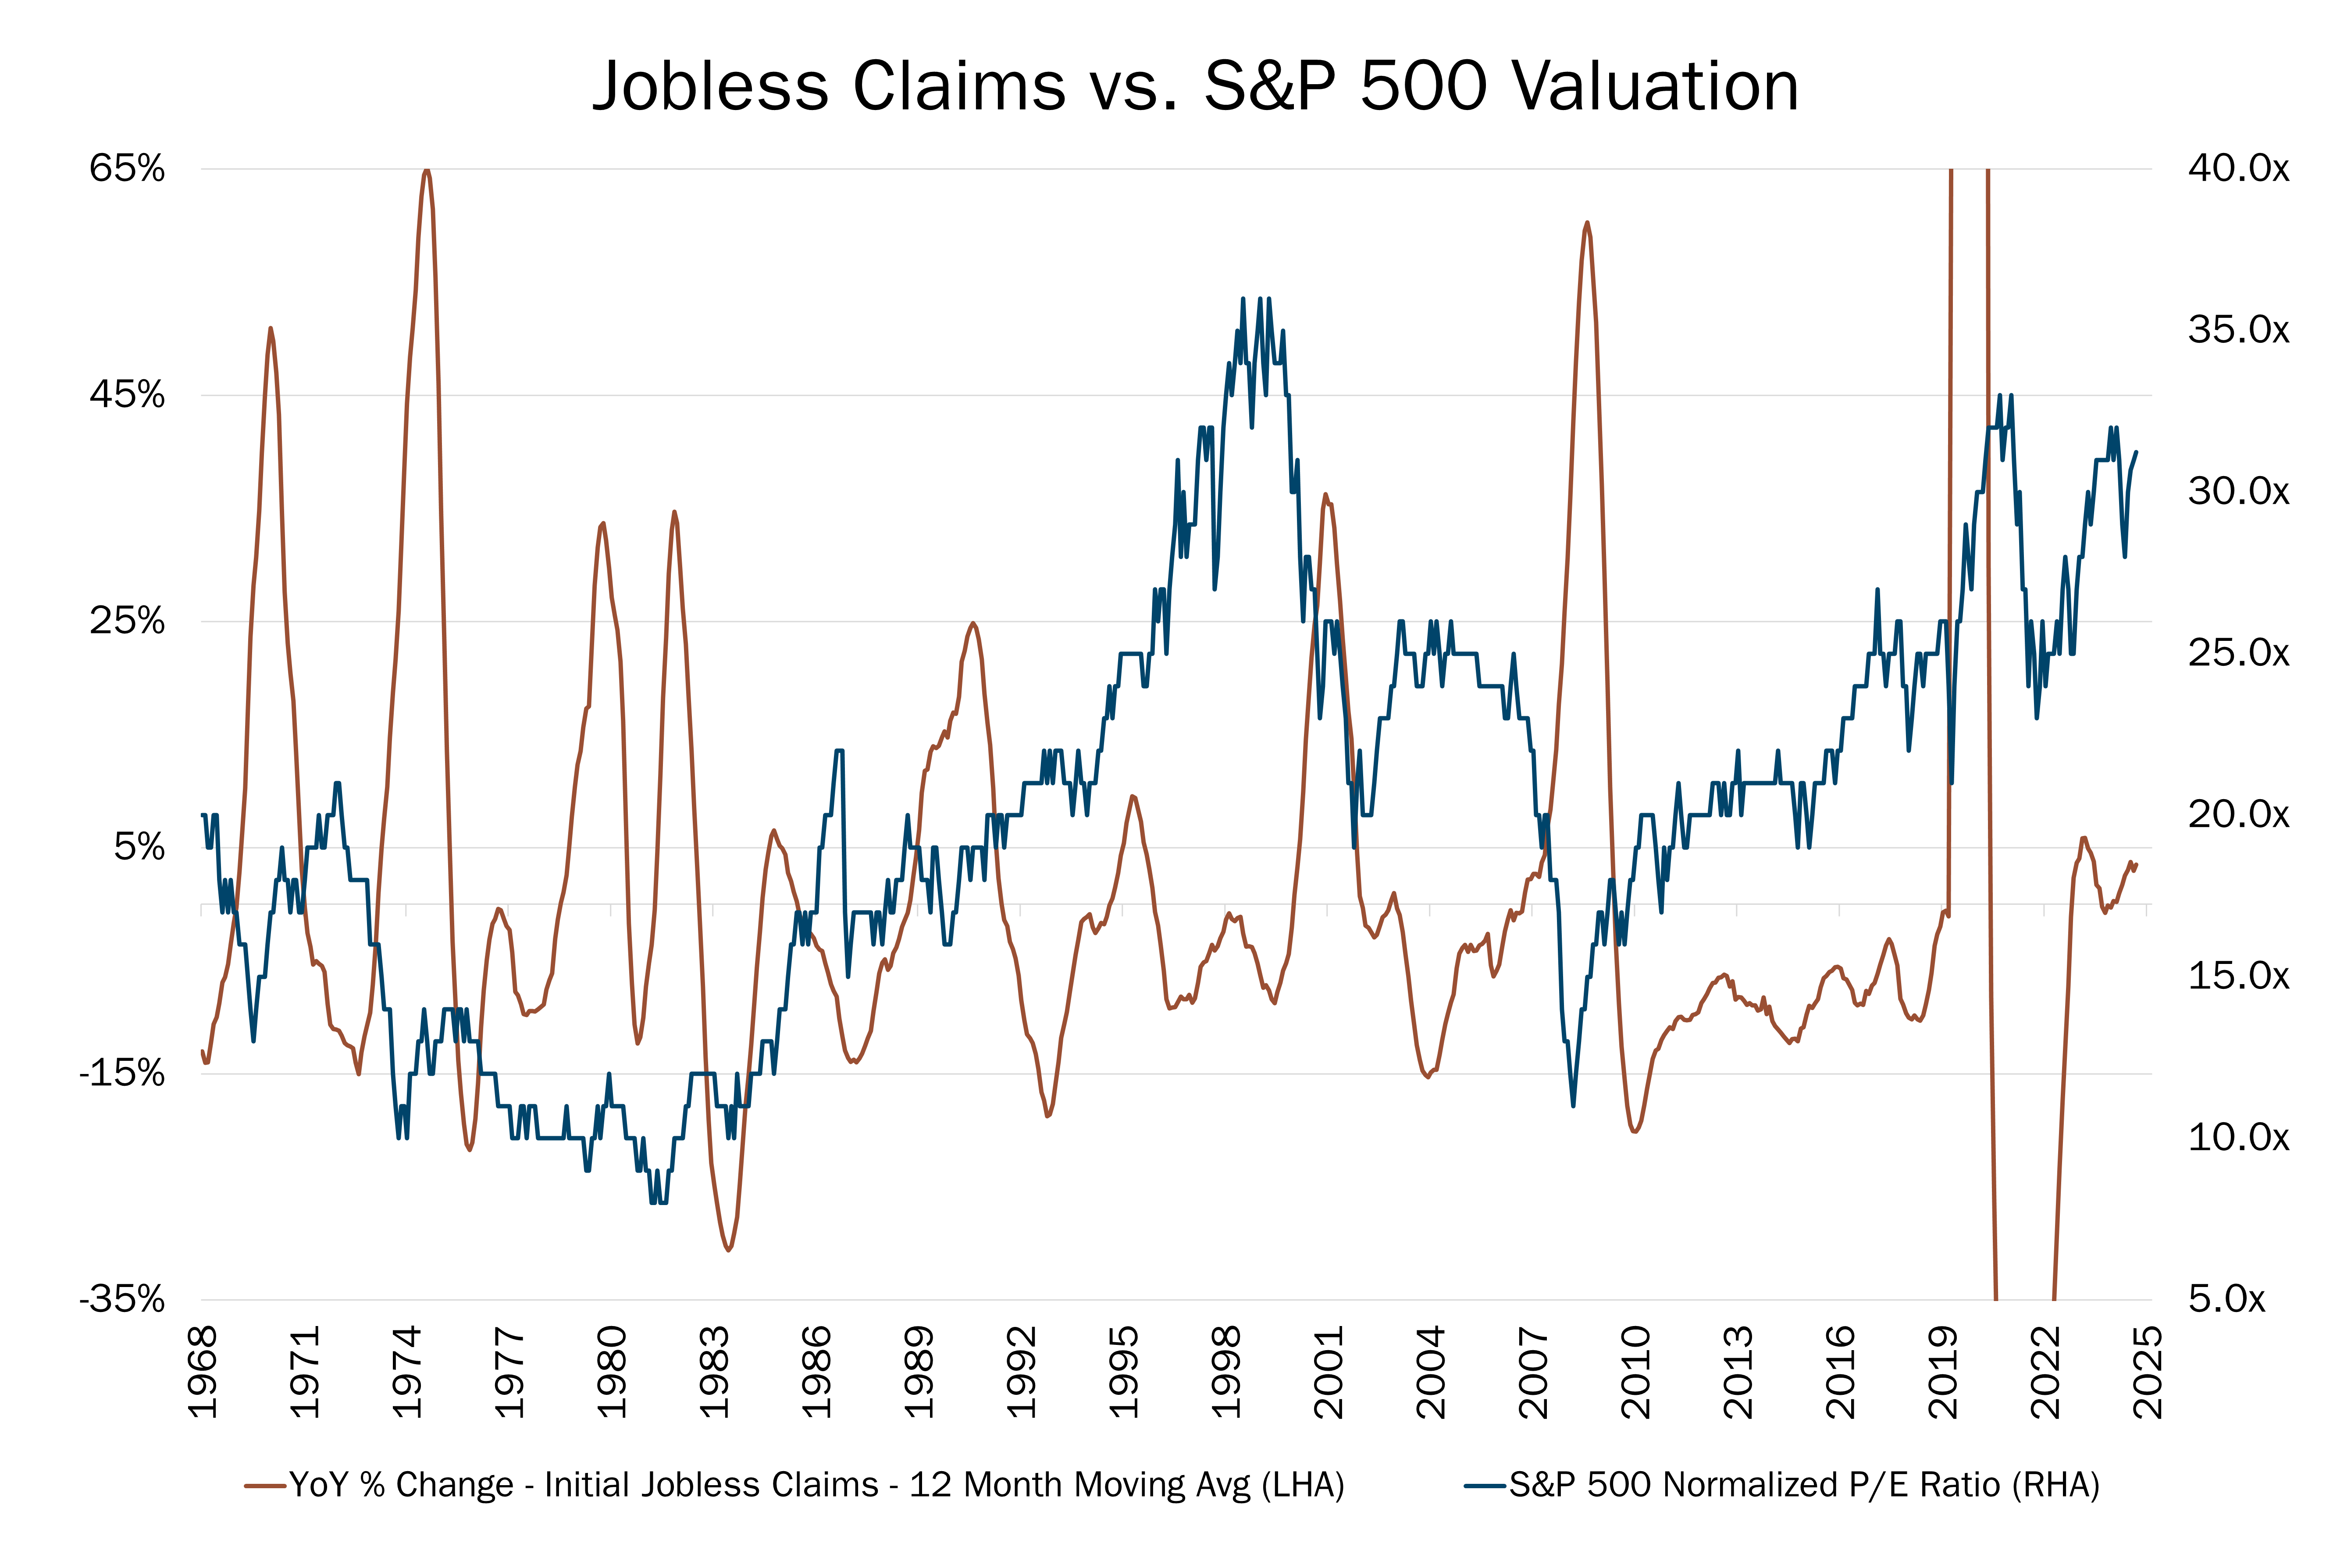
Source: FactSet Research Systems Inc. and The Leuthold Group. Monthly data, 12/31/1968 to 8/29/2025. This chart shows the year over year percent change for initial jobless claims on a 12-month moving average verses the S&P 500 normalized price to earnings ratio. The S&P 500 Index is an index of 500 U.S. stocks chosen for market size, liquidity and industry group representation and is a widely used U.S. equity benchmark. Initial Unemployment (“Jobless”) Claims is a measure of the number of jobless claims filed by individuals seeking to receive state jobless benefits. Chart peaks for YoY % Change not shown are at a high 582% on 2/28/2021 and at a low of -75% on 3/31/2022. All indices are unmanaged. It is not possible to invest directly in an index. Past performance does not guarantee future results.
We’re not forecasting the timing of a recession, but history shows that when jobless claims start to rise, the trend generally doesn’t magically reverse course on its own. To us, this is suggestive of an environment where it makes sense to consider a wide range of potential outcomes and determine which of those outcomes are reflected in current valuation. This also seems to be the type of market where paying attention to the quality of what you own, and the price paid to own it is critical. For us, these traits are always at the forefront, along with the price paid for said attributes, based on our 10 Principles of Value Investing™.
As noted earlier this year, our Strategy’s day-to-day relative performance has been inversely correlated with the relative performance of a factor like momentum compared to a valuation attribute like free cash flow yield. The dramatic outperformance of momentum over free cash flow yield continued during the quarter and has coincided with extreme outperformance of high vs. low volatility stocks. However, we must also acknowledge that our stock-picking has made life harder in a generationally euphoric backdrop that challenges our style to begin with.
In the long run, we are confident that our approach to value, which is guided by our 10 Principles of Value Investing™ and its focus on attractively priced, financially sound businesses, will demonstrate its efficacy. We remain confident that a four-price target approach that respects a range of outcomes, valuation discipline and downside risk will prove its merits again. We remain unwilling to chase many companies in our universe that we consider either speculative or priced for perfection. In a generally expensive broad market, we observe valuation disparities across companies that are as wide as we can ever recall. We think this can be exploited with the right process and right time horizon.
The Mid Cap Value portfolio was up 1.63% in the third quarter, trailing the Russell Midcap® Value Index, which was up 6.18%. Stock selection was responsible for most of our underperformance, as our selection effect was negative in Health Care, Financials, Consumer Discretionary, Energy, Industrials, Real Estate, and Materials.
In addition to our 10 Principles of Value Investing™, our Strategy is built around our “two-bucket” approach to portfolio construction. At all times, we aim to hold both high quality mid cap companies trading at bargains (“Quality Value”) and deeply discounted businesses that have produced poor economic returns over time (“Deep Value”) but that have a self-help catalyst to unlock value. Within value, each of these styles tend to take turns outperforming, just as periods of growth and value outperformance tend to alternate over time.
![]()
Consumer Discretionary. Our best-performing holding in the quarter, D.R. Horton (DHI), came from our Deep Value bucket. The largest homebuilder in the country, DHI enjoys around a 10% market share with scale advantages in a highly fragmented industry.
The company has a particularly strong position in entry-level homes. To produce affordable housing, D.R. Horton runs the business with speculative inventory, meaning it builds homes before buyer contracts are signed. This allows the company to operate the business more like a manufacturer thereby reducing unit costs with most savings passed to the homebuyer. To accommodate this business model, the company’s balance sheet is notably strong, allowing for maximum flexibility in capital allocation. For more than a decade, management pivoted the company’s balance sheet away from owning large swaths of undeveloped land, preferring instead to use less capital-intensive methods to source buildable lots. This self-help strategy reduced the capital commitment to the business and increased returns on investments.
Along with the entire homebuilding industry, DHI sold off late in late 2024 and early this year, owing to weak demand and heavy discounting across the industry. We used the selloff to establish a position, marking our fourth time owning DHI. We further increased our weighting during the broad market selloff at the end of the first quarter and in early Q2.
The stock rose sharply this quarter on earnings that beat analyst expectations on both home deliveries and gross margin. In addition, orders — while flat year over year — exceeded the street’s expectations by more than 4 percentage points. Management accelerated its share repurchases, buying back more than 3% of the company in Q3 alone. That, plus falling long-term interest rates and a 13-F filing by Berkshire Hathaway detailing a new stake in DHI, also propelled the shares.
DHI currently trades at 2.1x book value, which is slightly higher than the company’s long-term median multiple of 1.8x. In our view, the company’s return on and of capital has structurally improved, which will inflate this multiple, all else equal. If not for $7 billion of share repurchases over the past 12 quarters, DHI would be trading at a discount of 1.5x, despite a sustainable return on equity of greater than 15%.
![]()
Information Technology. A standout Quality Value holding was Lam Research (LRCX). Lam is a supplier of semiconductor capital equipment (SemiCap) with a leading market position in technology integral to the production of the chip industry’s most advanced integrated circuits.
Over the past decade, the SemiCap industry has consolidated, with 5 companies controlling almost 75% of the market. Lam is dominant in the Etch market, a process by which chips are created by selectively removing materials from the wafer to transfer patterns. Industry consolidation and improved customer profitability helped create a structurally more profitable SemiCap industry over time. Lam’s leadership position with Memory customers proved fortuitous, as many of the key applications used by those customers became mission-critical for manufacturers producing today’s leading-edge chips (even outside of the Memory industry). This leaves the company uniquely positioned to gain share in an industry that already benefits from structurally higher customer capital intensity and growing base of recurring revenue. A cyclical downturn and market volatility earlier this year gave us the chance to buy shares at a compelling valuation. A new upcycle and clear market share gains helped drive strong recent performance in the shares.
![]()
Health Care. Our worst performing holding in the quarter was Centene (CNC). Shares of the managed care company suffered from a policy-induced risk pool shift in the ACA Healthcare Exchanges that negatively impacted profit margins and caused a pre-announced earnings cut, nearly a month ahead of the scheduled earnings release date. Frankly, we were evaluating a position size reduction given the policy changes but were surprised by the announcement timing. Recognizing the short-tailed nature of the liabilities (allowing faster adjustments than other forms of insurance), we waited for management to formally articulate their plans to address the issue in late July. We came away encouraged by aggressive pricing actions meant to reflect recent developments and restore margins. In September, the company provided a positive update on the action plan that helped shares begin to recover from July’s sharp selloff. Meanwhile, political pressure has intensified from both sides of the aisle to address the looming health insurance affordability crisis. Any policy improvement would further supplement the actions taken by CNC, which assume no relief. The stock trades at 11x 2026 earnings estimates which look increasingly beatable based on the recent update.
Last quarter, the markets punished those who weren’t all-in on the AI boom and who paid attention to downside risks. However, as long-term-minded investors, we consider this basic table stakes for being active managers. It’s our job to consider as wide a range of outcomes as possible when constructing the portfolio to allocate capital based on the best risk-reward scenarios. This isn’t because we know exactly how the economy will unfold and fear trouble ahead; it’s precisely because we don’t know. In the meantime, our job is to focus on those things in our control, such as trying to select companies with strong balance sheets, management teams, business strategies, and earnings dynamics— and how much they paid for those attributes.
Scroll over to view complete data
Source: FactSet Research Systems Inc., Russell®, and Heartland Advisors, Inc.
The inception date for the Mid Cap Value Fund is 10/31/2014 for the investor and institutional class.
©2026 Heartland Advisors | 790 N. Water Street, Suite 1200, Milwaukee, WI 53202 | Business Office: 414-347-7777 | Financial Professionals: 888-505-5180 | Individual Investors: 800-432-7856
In the prospectus dated 5/1/2026, the Net Fund Operating Expenses for the investor and institutional classes of the Mid Cap Value Fund are 1.10% and 0.85%, respectively. The Advisor has contractually agreed to waive its management fees and/or reimburse expenses of the Fund to ensure that Net Fund Operating Expenses for the Fund do not exceed 1.10% of the Fund’s average net assets for the investor class shares and 0.85% for the institutional class shares, through at least 4/5/2028, and subject thereafter to annual reapproval of the agreement by the Board of Directors. Without such waiver and/or reimbursements, the Gross Fund Operating Expenses would be 1.21% for the investor class shares and 0.95% for the institutional class shares.
Past performance does not guarantee future results. Performance represents past performance; current returns may be lower or higher. Performance for institutional class shares prior to their initial offering is based on the performance of investor class shares. The investment return and principal value will fluctuate so that an investor's shares, when redeemed, may be worth more or less than the original cost. All returns reflect reinvested dividends and capital gains distributions, but do not reflect the deduction of taxes that an investor would pay on distributions or redemptions. Subject to certain exceptions, shares of a Fund redeemed or exchanged within 10 days of purchase are subject to a 2% redemption fee. Performance does not reflect this fee, which if deducted would reduce an individual's return. To obtain performance through the most recent month end, call 800-432-7856 or visit heartlandadvisors.com.
An investor should consider the Funds’ investment objectives, risks, and charges and expenses carefully before investing or sending money. This and other important information may be found in the Funds' prospectus. To obtain a prospectus, please call 800-432-7856 or visit heartlandadvisors.com. Please read the prospectus carefully before investing.
As of 9/30/2025, Centene Corp. (CNC), D.R. Horton, Inc. (DHI), and Lam Research Corp. (LRCX) represented 2.04%, 2.42%, and 1.50% of the Mid Cap Value Fund’s net assets, respectively.
Statements regarding securities are not recommendations to buy or sell.
Portfolio holdings are subject to change. Current and future portfolio holdings are subject to risk.
The Mid Cap Value Fund invests in a smaller number of stocks (generally 40 to 60) than the average mutual fund. The performance of these holdings generally will increase the volatility of the Fund’s returns. The Fund also invests in mid-sized companies on a value basis. Mid-sized securities generally are more volatile and less liquid than those of larger companies.
Value investments are subject to the risk that their intrinsic value may not be recognized by the broad market.
The Mid Cap Value Fund seeks long-term capital appreciation and modest current income.
The Fund’s performance information included in regulatory filings includes a required index that represents an overall securities market (Regulatory Benchmark). In addition, the Fund's regulatory filings may also include an index that more closely aligns to the Fund's investment strategy (Strategy Benchmark(s)). The Fund's performance included in marketing and advertising materials and information other than regulatory filings is generally compared only to the Strategy Benchmark.
The above individuals are registered representatives of ALPS Distributors, Inc.
The Heartland Funds are distributed by ALPS Distributors, Inc.
The statements and opinions expressed in this article are those of the presenter(s). Any discussion of investments and investment strategies represents the presenters’ views as of the date created and are subject to change without notice. The opinions expressed are for general information only and are not intended to provide specific advice or recommendations for any individual. The specific securities discussed, which are intended to illustrate the advisor’s investment style, do not represent all of the securities purchased, sold, or recommended by the advisor for client accounts, and the reader should not assume that an investment in these securities was or would be profitable in the future. Certain security valuations and forward estimates are based on Heartland Advisors’ calculations. Any forecasts may not prove to be true.
Economic predictions are based on estimates and are subject to change.
There is no guarantee that a particular investment strategy will be successful.
Sector and Industry classifications are sourced from GICS®.The Global Industry Classification Standard (GICS®) is the exclusive intellectual property of MSCI Inc. (MSCI) and S&P Global Market Intelligence (“S&P”). Neither MSCI, S&P, their affiliates, nor any of their third party providers (“GICS Parties”) makes any representations or warranties, express or implied, with respect to GICS or the results to be obtained by the use thereof, and expressly disclaim all warranties, including warranties of accuracy, completeness, merchantability and fitness for a particular purpose. The GICS Parties shall not have any liability for any direct, indirect, special, punitive, consequential or any other damages (including lost profits) even if notified of such damages.
Heartland Advisors defines market cap ranges by the following indices: micro-cap by the Russell Microcap®, small-cap by the Russell 2000®, mid-cap by the Russell Midcap®, large-cap by the Russell Top 200®.
Because of ongoing market volatility, performance may be subject to substantial short-term changes.
Dividends are not guaranteed and a company’s future ability to pay dividends may be limited. A company currently paying dividends may cease paying dividends at any time.
There is no assurance that dividend-paying stocks will mitigate volatility.
CFA® is a registered trademark owned by the CFA Institute.
Russell Investment Group is the source and owner of the trademarks, service marks and copyrights related to the Russell Indices. Russell® is a trademark of the Frank Russell Investment Group.
Data sourced from FactSet: Copyright 2026 FactSet Research Systems Inc., FactSet Fundamentals. All rights reserved.
Heartland’s investing glossary provides definitions for several terms used on this page.
Artificial intelligence (AI) is intelligence—perceiving, synthesizing, and inferring information—demonstrated by computers, as opposed to intelligence displayed by humans or by other animals. Cyclical Stocks cover Basic Materials, Capital Goods, Communications, Consumer Cyclical, Energy, Financial, Technology, and Transportation which tend to react to a variety of market conditions that can send them up or down and often relate to business cycles. Free Cash Flow is the amount of cash a company has after expenses, debt service, capital expenditures, and dividends. The higher the free cash flow, the stronger the company’s balance sheet. Free Cash Flow Yield is calculated as the amount of cash a company has after expenses, debt service, capital expenditures, and dividends divided by either its current market price per share or enterprise value. Leverage is the amount of debt used to finance a firm's assets. A firm with significantly more debt than equity is considered to be highly leveraged. Momentum is the rate of acceleration of a security's price or trade volume. Relative Value is a method of determining an asset's value that takes into account the value of similar assets. Calculations that are used to measure the relative value of stocks include the enterprise ratio and price-to-earnings ratio. Russell Midcap® Value Index measures the performance of those Russell Midcap® Index companies with lower price/book ratios and lower forecasted growth characteristics. All indices are unmanaged. It is not possible to invest directly in an index. Upside Capture/Downside Capture vs. Market is a measure used to evaluate how well a manager or index performed (gained more or lost less) relative to another index during periods when that index rose or fell. Market is defined as the X Index. Volatility is a statistical measure of the dispersion of returns for a given security or market index which can either be measured by using the standard deviation or variance between returns from that same security or market index. Commonly, the higher the volatility, the riskier the security. 10 Principles of Value Investing™ consist of the following criteria for selecting securities: (1) catalyst for recognition; (2) low price in relation to earnings; (3) low price in relation to cash flow; (4) low price in relation to book value; (5) financial soundness; (6) positive earnings dynamics; (7) sound business strategy; (8) capable management and insider ownership; (9) value of company; and (10) positive technical analysis.


