See standardized performance at the end.
On an absolute basis, mid-cap stocks performed well during the second quarter, with the Russell Midcap® Index up 13.40%.
The excitement surrounding artificial intelligence (AI) is at a euphoric pitch, even in the value side of mid-cap where dozens of companies across several sectors are currently benefitting from a massive AI infrastructure spending boom. The two largest stocks in the Russell Midcap® Value Index are computer hardware manufacturers benefiting from the buildout of data centers. Their shares have rocketed nearly 5,000% and nearly 1,000%, respectively, over the past 12 months.
This dynamic is not limited to just these two companies. As the table below shows, investors continue to reward the perceived winners of AI at a stunning rate. In this backdrop, factor analysis showed momentum outperforming free cash flow yield by over 1000 basis points throughout the quarter until the end of June. In the final week of June, all that outperformance was erased amid a sudden rotation away from stocks at the heart of AI speculation. We were overweight five of the top twenty-five contributors or twice the ownership concentration of the entire portfolio relative to the benchmark. Despite this fact, the strategy underperformed in the quarter underscoring how concentrated index returns were.
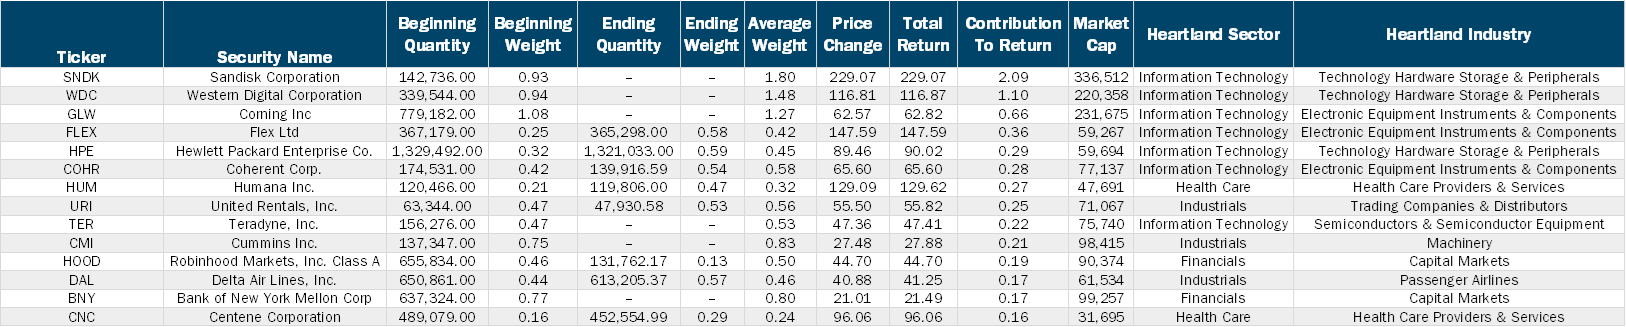
Source: Heartland Advisors, Inc. Monthly data from 3/31/2026 to 6/30/2026. The data in this chart shows the Top 15 Contributors to Russell Midcap Value Index. Portfolio holdings as of date: Russell Midcap Value 4/01/2026 through 6/30/2026. All indices are unmanaged. It is not possible to invest in an index. Past performance does not guarantee future results.
It should be noted that the list of perceived AI “losers” has also expanded. Rapidly changing assessments of perceived winners and losers drive extreme daily price movements, in many cases far beyond the likely underlying value of the companies. We believe this is the type of market where it’s critical to maintain discipline. For us, discipline means staying true to our 10 Principles of Value Investing™, which guides our security selection process. The 10 Principles help direct us to companies with strong business models, balance sheets, competitive advantages, and fundamentals that should prove beneficial through an investment cycle.
Although today’s market is narrow and, in our view, expensive at the index level, attractively priced companies with sound prospects remain available. In many cases, investors do not need to bet against an AI disruption narrative simply because a stock appears cheap. Some companies may capture enduring benefits from AI. We are investors who do appreciate the profound impact AI is likely to have in the decades to come. Like prior technological revolutions — including railroads, the internal combustion engine, semiconductors, and the internet — AI has already begun to change the prospects of many businesses and will likely continue to do so.
However, the long-term beneficiaries of revolutionary technologies are often consumers and companies that harness those technologies as they become cheaper and more widely available. By contrast, infrastructure suppliers can experience boom-bust cycles, as capital chases growth and seemingly attractive returns until excess supply erodes pricing power and profitability. Even when markets correctly identify a technology’s profound impact, shareholder returns can remain uncertain for decades. Railroads offer a useful example. The Baltimore and Ohio Railroad was built nearly two centuries ago, yet its modern owner, CSX, along with the remaining North American Class I railroads, only became attractive long-term investments after more than a century of consolidation created regional duopolies. Investors betting on the importance of railroads were not wrong thematically, but attractive returns were far from assured. Today’s AI infrastructure boom may follow a similar pattern.
A key component of our approach is planning for a range of potential outcomes. For every investment we hold or consider owning, we establish four separate price expectations: a base case, an upside scenario, a downside case, and a maximum downside scenario associated with severe business stress. This framework helps us assess whether price movements fairly reflect changes in underlying fundamentals, are instead being driven by short-term sentiment, or both. As investors’ views change rapidly, scenario planning gives us the ability to act quickly when dislocations occur.
The Mid Cap Value Fund gained 9.90% in the second quarter, trailing the Russell Midcap® Value Index’s 13.40% return. Negative stock selection drove most of the underperformance, with majority of the selection drag coming from the Technology sector, the epicenter of recent euphoria. This underperformance occurred despite Tech being one of our top absolute return contributors, driven by two holdings that appreciated well over 50% and zero negative operational updates across the sector. The two largest contributors to index performance—including its top holding, a NAND flash memory manufacturer that soared nearly 230% in the quarter—accounted for roughly half of all Tech sector gains and more than a quarter of total index return.
Overall, this was a challenging period for our Fund, but we remain committed to a disciplined approach to security selection that we believe will reward investors—including ourselves—over time. Our mid-cap portfolio utilizes a structured “two-bucket” approach, balancing high-quality companies (“Quality Value”) trading at significant discounts with deeply discounted businesses (“Deep Value”) that have historically produced poor economic returns. Within the Deep Value bucket, we demand a self-help catalyst to alter market perception and unlock value; because these businesses can underperform for long stretches. We refuse to rely solely on a macro tailwind in Deep Value, even in the cases of extremely low valuations. Over the past three months, Deep Value outperformed Quality Value across both our benchmark and the portfolio.

Technology. In our Deep Value bucket, ON Semiconductor (ON) manufactures power management and image sensing semiconductor products for automotive and industrial end markets.
ON is a leader in silicon carbide semiconductors, which are used primarily in electric vehicles (EVs), renewable energy inverters, and high-power industrial equipment to reduce energy loss and improve efficiency. ON endured a cyclical deceleration in its auto and clean-energy-related markets that began in 2023. Throughout the downturn, management implemented a robust self-help playbook that optimized the company’s manufacturing footprint and product portfolio for both a cyclical upturn and secular growth drivers. This included a new product platform with much higher profit margins than the existing business.
More recently, the company has gained market share with leading global EV manufacturers, enjoying outsized representation in newer car models. In AI datacenters, power voltage requirements are rising, helping to drive adoption for ON’s next-generation power management solutions.
However, investors counting on rapid datacenter-related growth should keep in mind that, even in the most optimistic scenarios, datacenter-related revenue will be a materially smaller percentage of ON’s sales compared to its core automotive and industrial end markets. Nevertheless, the market was willing to capitalize future datacenter benefits in short order. After more than doubling in price by early June, the stock reached our price target, and we reduced our weighting. We acknowledge that multiple drivers for ON have come together simultaneously, creating potential for an intrinsic value scenario. We intend to maintain a reasonably sized position.

Financials. While ON was one of the Fund’s top contributor last quarter, the biggest detractor to our Strategy’s performance was MarketAxess Holdings (MKTX), a position we initiated in the first quarter and built in the second quarter. MKTX operates the largest U.S. corporate bond e-trading platform. It sits in a market blind spot—neither championed as an AI winner nor penalized by the AI disruption narrative—offering a high-quality, attractively valued profile with self-help-driven margin expansion potential. However, current macro conditions are a headwind. Heavy primary bond issuance volume, much of it financing the AI boom, alongside tighter credit spreads, has temporarily diverted trading volume away from MKTX's core secondary market.
Why do we remain confident in MKTX? First, the company is exiting a heavy investment cycle that historically pressured margins, setting up strong operating leverage as the pace of spending plateaus and volumes improve. Second, industry trading data indicates market share gains across a key U.S. credit trading protocol where the company investments have been focused. Third, MKTX holds distinct scale advantages in developed international and emerging markets, where electronic trading penetration is still low by comparison to the U.S. Valuation is also highly compelling: the stock trades at 8.8X consensus 2026 Enterprise Value/EBITDA versus a domestic peer median of 14.0X. Despite its superior profit margins and balance sheet, MarketAxess yields over 8% on a FCF/EV basis and is well-positioned for a multi-year profit growth cycle.

Materials. A new deep-value holding is International Flavors and Fragrances (IFF), a specialty ingredient producer that sells flavors, fragrances, and enzymes to food, beverage, personal care, household products, and human health product manufacturers. This is an example of identifying a self-help opportunity through bottom-up research.
For more than two years, management has worked on streamlining IFF’s portfolio and operations to focus on higher-margin businesses where it enjoys leading market share, better pricing power, attractive growth, and significantly enhanced capital allocation flexibility. This strategy follows years of wayward capital allocation executed by prior management. Today, IFF’s revenue is evenly split across three segments. Taste accounts for 30% of profits, Health & Biosciences generates 37%, and Scent contributes 32%. In the Scent segment, IFF's pioneering of encapsulated fragrance technology secured its leadership in fabric care, a position now expanding into scent boosters, shampoos, and body washes.
Driven by improving growth, margins, and free cash flow, we believe IFF is poised to operationally resemble industry leader Givaudan. Yet while Givaudan trades at 19.14X forward EBITDA, IFF trades at a steep discount of just 12.23X. Highlighting management's confidence in this valuation gap closing, the company recently instituted its first share buyback program in six years.
In a broadly expensive market, valuation disparities remain as wide as we can recall—a dislocation we believe can be exploited with the right process and time horizon. In our opinion, successful investing is about managing risk, not avoiding it. Though we disagree with the market's current speculative herd mentality, we see opportunity amid the noise. AI's implications are real, but many stocks are mispriced on both sides of the narrative. Our mandate as active value managers is to find these dislocations, whether they are perceived losers today, overlooked potential winners, or ignored businesses in between. Guiding us through this noise are our four price targets, which keep us disciplined, and our 10 Principles of Value Investing™, which ensure a consistent analytical framework.
Scroll over to view complete data
| Since Inception (%) | 20-Year (%) | 15-Year (%) | 10-Year (%) | 5-Year (%) | 3-Year (%) | 1-Year (%) | YTD* (%) | QTD* (%) | |
|---|---|---|---|---|---|---|---|---|---|
| Mid Cap Value Investor Class | 8.21 | -- | -- | 8.96 | 5.62 | 6.72 | 6.85 | 8.94 | -4.77 |
| Mid Cap Value Institutional Class | 8.48 | -- | -- | 9.22 | 5.89 | 6.95 | 7.01 | 9.12 | -4.74 |
| Russell Midcap® Value | 9.19 | 8.90 | 12.36 | 9.93 | 9.26 | 17.50 | 16.89 | 15.25 | -1.98 |
*Not annualized
Source: FactSet Research Systems Inc., Russell®, and Heartland Advisors, Inc.
The inception date for the Mid Cap Value Fund is 10/31/2014 for the investor and institutional class.
In the prospectus dated 5/1/2026, the Net Fund Operating Expenses for the investor and institutional classes of the Mid Cap Value Fund are 1.10% and 0.85%, respectively. The Advisor has contractually agreed to waive its management fees and/or reimburse expenses of the Fund to ensure that Net Fund Operating Expenses for the Fund do not exceed 1.10% of the Fund’s average net assets for the investor class shares and 0.85% for the institutional class shares, through at least 4/5/2028, and subject thereafter to annual reapproval of the agreement by the Board of Directors. Without such waiver and/or reimbursements, the Gross Fund Operating Expenses would be 1.21% for the investor class shares and 0.95% for the institutional class shares.
Past performance does not guarantee future results. Performance represents past performance; current returns may be lower or higher. Performance for institutional class shares prior to their initial offering is based on the performance of investor class shares. The investment return and principal value will fluctuate so that an investor's shares, when redeemed, may be worth more or less than the original cost. All returns reflect reinvested dividends and capital gains distributions, but do not reflect the deduction of taxes that an investor would pay on distributions or redemptions. Subject to certain exceptions, shares of a Fund redeemed or exchanged within 10 days of purchase are subject to a 2% redemption fee. Performance does not reflect this fee, which if deducted would reduce an individual's return. To obtain performance through the most recent month end, call 800-432-7856 or visit heartlandadvisors.com.


©2026 Heartland Advisors | 790 N. Water Street, Suite 1200, Milwaukee, WI 53202 | Business Office: 414-347-7777 | Financial Professionals: 888-505-5180 | Individual Investors: 800-432-7856
In the prospectus dated 5/1/2026, the Net Fund Operating Expenses for the investor and institutional classes of the Mid Cap Value Fund are 1.10% and 0.85%, respectively. The Advisor has contractually agreed to waive its management fees and/or reimburse expenses of the Fund to ensure that Net Fund Operating Expenses for the Fund do not exceed 1.10% of the Fund’s average net assets for the investor class shares and 0.85% for the institutional class shares, through at least 4/5/2028, and subject thereafter to annual reapproval of the agreement by the Board of Directors. Without such waiver and/or reimbursements, the Gross Fund Operating Expenses would be 1.21% for the investor class shares and 0.95% for the institutional class shares.
Past performance does not guarantee future results. Performance represents past performance; current returns may be lower or higher. Performance for institutional class shares prior to their initial offering is based on the performance of investor class shares. The investment return and principal value will fluctuate so that an investor's shares, when redeemed, may be worth more or less than the original cost. All returns reflect reinvested dividends and capital gains distributions, but do not reflect the deduction of taxes that an investor would pay on distributions or redemptions. Subject to certain exceptions, shares of a Fund redeemed or exchanged within 10 days of purchase are subject to a 2% redemption fee. Performance does not reflect this fee, which if deducted would reduce an individual's return. To obtain performance through the most recent month end, call 800-432-7856 or visit heartlandadvisors.com.
An investor should consider the Funds’ investment objectives, risks, and charges and expenses carefully before investing or sending money. This and other important information may be found in the Funds' prospectus. To obtain a prospectus, please call 800-432-7856 or visit heartlandadvisors.com. Please read the prospectus carefully before investing.
As of 6/30/2026, International Flavors & Fragrances Inc. (IFF), MarketAxess Holdings Inc. (MKTX), ON Semiconductor Corporation (ON), represented 1.00%, 1.86%, and 0.97% of the Mid Cap Value Fund’s net assets, respectively. Givaudan (GIVN) is unowned by the Heartland Mid Cap Value Fund.
Statements regarding securities are not recommendations to buy or sell.
Portfolio holdings are subject to change. Current and future portfolio holdings are subject to risk.
The Mid Cap Value Fund invests in a smaller number of stocks (generally 40 to 60) than the average mutual fund. The performance of these holdings generally will increase the volatility of the Fund’s returns. The Fund also invests in mid-sized companies on a value basis. Mid-sized securities generally are more volatile and less liquid than those of larger companies.
Value investments are subject to the risk that their intrinsic value may not be recognized by the broad market.
The Mid Cap Value Fund seeks long-term capital appreciation and modest current income.
The Fund’s performance information included in regulatory filings includes a required index that represents an overall securities market (Regulatory Benchmark). In addition, the Fund's regulatory filings may also include an index that more closely aligns to the Fund's investment strategy (Strategy Benchmark(s)). The Fund's performance included in marketing and advertising materials and information other than regulatory filings is generally compared only to the Strategy Benchmark.
The above individuals are registered representatives of ALPS Distributors, Inc.
The Heartland Funds are distributed by ALPS Distributors, Inc.
The statements and opinions expressed in this article are those of the presenter(s). Any discussion of investments and investment strategies represents the presenters’ views as of the date created and are subject to change without notice. The opinions expressed are for general information only and are not intended to provide specific advice or recommendations for any individual. The specific securities discussed, which are intended to illustrate the advisor’s investment style, do not represent all of the securities purchased, sold, or recommended by the advisor for client accounts, and the reader should not assume that an investment in these securities was or would be profitable in the future. Certain security valuations and forward estimates are based on Heartland Advisors’ calculations. Any forecasts may not prove to be true.
Economic predictions are based on estimates and are subject to change.
There is no guarantee that a particular investment strategy will be successful.
Sector and Industry classifications are sourced from GICS®.The Global Industry Classification Standard (GICS®) is the exclusive intellectual property of MSCI Inc. (MSCI) and S&P Global Market Intelligence (“S&P”). Neither MSCI, S&P, their affiliates, nor any of their third party providers (“GICS Parties”) makes any representations or warranties, express or implied, with respect to GICS or the results to be obtained by the use thereof, and expressly disclaim all warranties, including warranties of accuracy, completeness, merchantability and fitness for a particular purpose. The GICS Parties shall not have any liability for any direct, indirect, special, punitive, consequential or any other damages (including lost profits) even if notified of such damages.
Heartland Advisors defines market cap ranges by the following indices: micro-cap by the Russell Microcap®, small-cap by the Russell 2000®, mid-cap by the Russell Midcap®, large-cap by the Russell Top 200®.
Because of ongoing market volatility, performance may be subject to substantial short-term changes.
Dividends are not guaranteed and a company’s future ability to pay dividends may be limited. A company currently paying dividends may cease paying dividends at any time.
There is no assurance that dividend-paying stocks will mitigate volatility.
CFA® is a registered trademark owned by the CFA Institute.
Russell Investment Group is the source and owner of the trademarks, service marks and copyrights related to the Russell Indices. Russell® is a trademark of the Frank Russell Investment Group.
Data sourced from FactSet: Copyright 2026 FactSet Research Systems Inc., FactSet Fundamentals. All rights reserved.
Heartland’s investing glossary provides definitions for several terms used on this page.
Artificial intelligence (AI) is intelligence—perceiving, synthesizing, and inferring information—demonstrated by computers, as opposed to intelligence displayed by humans or by other animals. Cyclical Stocks cover Basic Materials, Capital Goods, Communications, Consumer Cyclical, Energy, Financial, Technology, and Transportation which tend to react to a variety of market conditions that can send them up or down and often relate to business cycles. Free Cash Flow is the amount of cash a company has after expenses, debt service, capital expenditures, and dividends. The higher the free cash flow, the stronger the company’s balance sheet. Free Cash Flow Yield is calculated as the amount of cash a company has after expenses, debt service, capital expenditures, and dividends divided by either its current market price per share or enterprise value. Leverage is the amount of debt used to finance a firm's assets. A firm with significantly more debt than equity is considered to be highly leveraged. Momentum is the rate of acceleration of a security's price or trade volume. Relative Value is a method of determining an asset's value that takes into account the value of similar assets. Calculations that are used to measure the relative value of stocks include the enterprise ratio and price-to-earnings ratio. Russell Midcap® Value Index measures the performance of those Russell Midcap® Index companies with lower price/book ratios and lower forecasted growth characteristics. All indices are unmanaged. It is not possible to invest directly in an index. Upside Capture/Downside Capture vs. Market is a measure used to evaluate how well a manager or index performed (gained more or lost less) relative to another index during periods when that index rose or fell. Market is defined as the X Index. Volatility is a statistical measure of the dispersion of returns for a given security or market index which can either be measured by using the standard deviation or variance between returns from that same security or market index. Commonly, the higher the volatility, the riskier the security. 10 Principles of Value Investing™ consist of the following criteria for selecting securities: (1) catalyst for recognition; (2) low price in relation to earnings; (3) low price in relation to cash flow; (4) low price in relation to book value; (5) financial soundness; (6) positive earnings dynamics; (7) sound business strategy; (8) capable management and insider ownership; (9) value of company; and (10) positive technical analysis.