See standardized performance at the end.
Recently, the shifting mood of the market has felt a little like bumper bowling, with investors’ views of the economy seeming to bounce in the opposite direction every quarter. As fears over a tariff-induced recession began to moderate, the Russell Midcap® Index advanced 8.53% in the quarter while the S&P 500 climbed 10.94%.
The notion that the market has written the final chapter on where the economy is headed may be wishful thinking. In our view, visibility surrounding the tariff and fiscal policy remains frustratingly unclear. The feedback we’re hearing from many senior managers is that they’re waiting for greater clarity before committing to long-term investments.
Complicating matters further, traditional economic indicators are sending those same decision makers mixed signals about which way the economy may be headed. Leading and coincident economic indicators have generally moved in sync, with the latter confirming the former over time. However, in recent years, leading indicators have been weakening. In fact, the gap between the two is currently the widest it’s been in recent history, reflecting the difficulties faced by both company executives and investors (see the chart below).
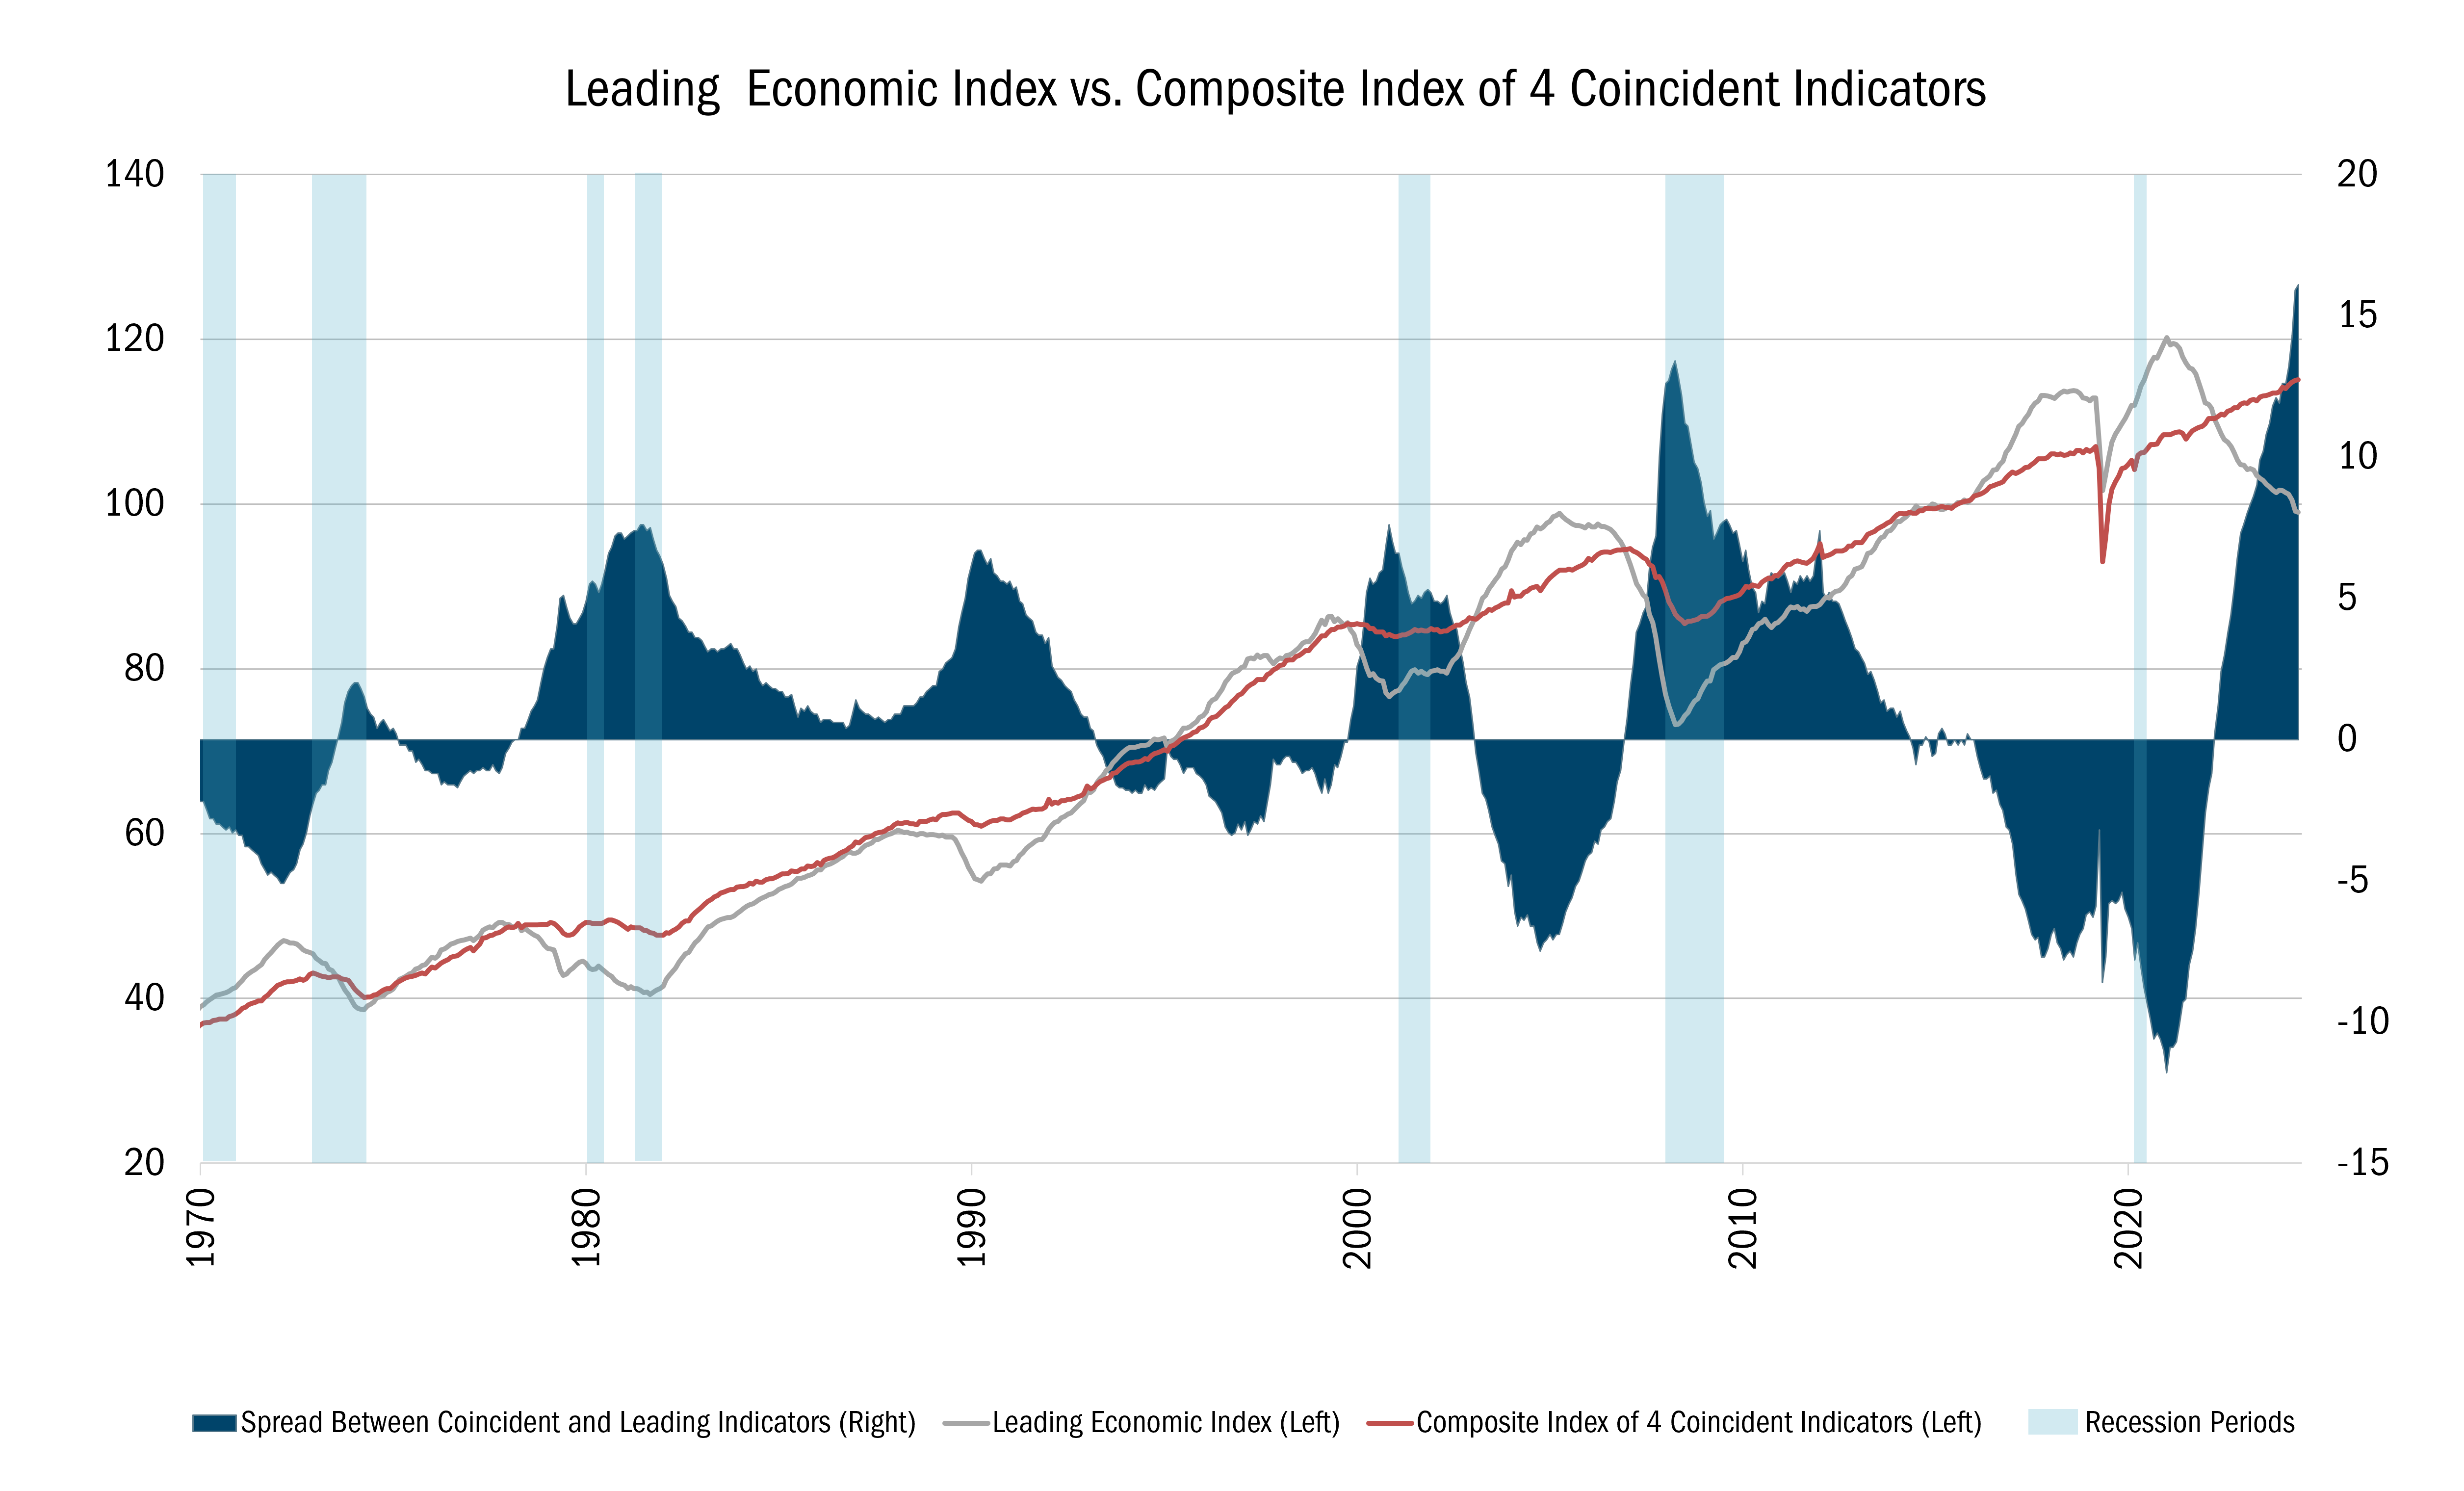
Source: FactSet Research Systems Inc., 1/31/1970 to 5/30/2025. This chart shows the Leading Economic Index versus Composite Index of 4 Coincident Indicators, and the spread between these two. The Composite Index of Leading Indicators, otherwise known as the Leading Economic Index (LEI), is an index published monthly by The Conference Board. It is used to predict the direction of global economic movements in future months. The Composite Index of Coincident Indicators is an index published by the Conference Board that provides a broad-based measurement of current economic conditions, helping economists, investors, and public policymakers to determine which phase of the business cycle the economy is currently experiencing. All indices are unmanaged. It is not possible to invest directly in an index. Past performance does not guarantee future results.
Besides company-specific forces, our relative performance has been influenced by several intertwined themes. In periods marked by compressed credit spreads and lower equity market volatility, growth strategies — and factors unrelated to valuation including momentum and earnings revisions — have routinely outperformed foundational valuation attributes like free cash flow yield. In the Russell Midcap Value universe, this dynamic was on full display, with historically extreme outperformance in the second quarter and for most of the time since the start of 2024. Over the long term, free cash flow-based valuation metrics have provided far more efficacy than momentum/revisions. Thematically, these dynamics were generally observed in companies somehow tied to cryptocurrency or artificial intelligence, amongst other examples. However, when risk aversion briefly returned to the market in February and March, these companies were among some of the hardest hit. At the same time, value outperformed growth and, for a brief-but-significant period, the free cash flow yield factor outperformed both momentum and revisions.
Our Strategy’s day-to-day relative performance is often inversely correlated with the growth-oriented factors and themes described above and positively correlated with the performance of attributes like free cash flow yield. We consider this evidence that our Strategy fits our piece of an asset allocation puzzle and sets the table for value-oriented stock-picking to assert its importance over time. We believe our approach to value, guided by our 10 Principles of Value Investing™ that focuses on attractively priced, financially sound businesses, is always important but could prove especially critical should any change to the running narrative occur.
The Mid Cap Value Fund lost 0.22% in the second quarter, trailing the Russell Midcap® Value Index, which was up 5.35%. Stock selection was responsible for most of our underperformance.
As the environment shifted from ‘risk-off’ back to ‘risk-on’ during the quarter, the Strategy was hurt by not owning certain high-octane names in cyclical parts of the market such as Technology, Industrials, and Consumer Discretionary, which were the three best-performing sectors of the benchmark in the quarter. It should be noted, however, that in February and March we were rewarded for not owning many of these companies when the rising tide ceased. During that brief pocket of volatility, we were able to buy shares of attractively priced companies that we believe will serve the portfolio well in the coming years.
In addition to our 10 Principles of Value Investing™, our Strategy is built around our “two-bucket” approach to portfolio construction. At all times, we hold both high quality mid cap companies trading at bargains (“Quality Value”) and deeply discounted businesses that have produced poor economic returns over time (“Deep Value”) but that have a self-help catalyst to unlock value. We do this because within value, each of these styles tend to take turns outperforming, just as periods of growth and value outperformance tend to alternate over time.
During the quarter, our stock selection in both buckets reversed versus Q1 and lagged in a sharply rising market. As risk aversion disappeared, a significant portion of the quarter’s underperformance was related to not owning many of the “higher octane” leaders in the Index because they do not fit our investment process in key areas related to valuation, financial soundness or business model attributes. That said, in a backdrop that didn’t favor traditional value companies to begin with, we had a few earnings updates that tested investors’ tolerance. In these cases, we believe patience is warranted, including in the Becton-Dickinson example below.
![]()
Financials. During the quarter, we initiated a position in Everest Group LTD (EG), a Deep Value global insurer with a long history of operating in the property natural catastrophe (NatCat) reinsurance market. Property & casualty underwriters such as Allstate, Progressive, and GEICO purchase NatCat reinsurance to protect their balance sheets against major weather events including hurricanes and earthquakes.
NatCat reinsurance is a commodity business where supply and demand dictate terms. When times are good, capacity enters the market, diminishing returns through competition. As a result, the return on equity (ROE) for the industry tends to be more volatile than for primary underwriters.
In Everest’s case, prior management made some poor underwriting decisions, pushing a diversification strategy that expanded the company’s exposure to the U.S. casualty market, which protects individuals and businesses from financial obligations resulting from bodily injury or death in the event of an accident. Unfortunately, U.S. casualty losses have risen meaningfully over the past decade due to an aggressive plaintiff bar and “nuclear settlements” awarded to claimants.
The company’s new CEO has been aggressively repricing this risk. When insurance companies write less risk, capital can be freed up for other purposes, such as buying back shares. In essence, new management has adopted a shrink-to-grow strategy.
Meanwhile, the stock carries a heavily discounted valuation, trading at just 1x tangible book value, versus Everest’s 25-year average of around 1.15x tangible book value. Relative to its industry peers, the stock looks even cheaper, trading at a 40-50% discount to specialty P&C insurers and a 25-50% discount to property natural catastrophe insurers.
![]()
Industrials. A new Quality Value position initiated during the quarter was Hubbell Inc (HUBB), a leading electrical component manufacturer. Over the past decade, Hubbell implemented self-help actions to shift its portfolio away from traditional commercial construction end markets and toward the power grid/utility end market, which now represents more than two-thirds of sales, thereby reducing exposure to construction spending cycles. At the same time, Hubbell has simplified its product offerings and consolidated 15% of its footprint, rationalizing underutilized assets and creating flexible capacity for faster-growing markets.
During the pandemic-related supply chain disruptions, many of Hubbell’s utility customers over-ordered products to ensure availability in the field. By 2024, as lead times normalized, destocking efforts accelerated and organic revenue turned negative. The stock came under further pressure in early 2025, as investor sentiment toward power generation demand took a hit.
As a result, the stock is now attractively priced in our opinion. After trading at a median 15% premium to its peers over the past 5 years and a 5% premium over the past decade, HUBB fell to a 10% discount in April and is now roughly in line with other Industrial companies on an EV/EBITDA basis. We also expect the company to benefit from continued demand for transmission and distribution infrastructure owing to the country’s aged electrical grid, and Q1-25 earnings confirmed our view that customer destocking has generally ceased.
![]()
Health Care. Our Strategy’s worst performer was Becton, Dickinson and Company (BDX), the world’s largest provider of healthcare consumable products such as needles, syringes and medication management systems.
Since the end of April, BDX shares have fallen nearly 20% after the company lowered its 2025 guidance to reflect the impact of the National Institute of Health funding cuts and an expected $0.25 EPS hit from tariffs. Even if growth fails to accelerate from the low single-digit rate implied for this year, we consider the multiple compression overblown for a business that has little or no risk of facing an earnings cliff.
We think investors are underestimating the durability of BDX’s mission-critical position in healthcare settings and its ability to adapt. The company has a strong track record of navigating fluid circumstances, being among the first in its industry to surpass its pre-COVID-19 margins following the global pandemic. We believe BDX can reaccelerate organic growth and drive further margin expansion, despite being priced for neither to occur.
The company has also reshaped its pipeline to target higher-growth markets that should align it more closely with bellwether med-tech stocks that command premium multiples. At 12x earnings, there’s nothing premium about BDX’s current valuation. The stock currently trades at 15% discount to the Russell Midcap® Index based on Enterprise Value/EBITDA. For most of the past decade, BDX carried a premium relative multiple ranging from 10-60% compared to the same Index.
As consensus views on the economy keep changing and the market shifts from ‘risk on’ to risk off, we believe it is prudent to maintain a balanced strategy. That’s how we approach the mid-cap value universe — by aiming for a constant mix of high-quality companies trading at bargain prices and deeply discounted businesses with identified self-improvement catalysts. Our approach to value investing won’t always lead the market quarter to quarter, but we believe that fundamental factors such as strong free cash flow and attractive valuations are always valuable over time, especially when speculation exceeds risk aversion. In the meantime, our approach will remain consistent and disciplined.
Scroll over to view complete data
Source: FactSet Research Systems Inc., Russell®, and Heartland Advisors, Inc.
The inception date for the Mid Cap Value Fund is 10/31/2014 for the investor and institutional class.
©2026 Heartland Advisors | 790 N. Water Street, Suite 1200, Milwaukee, WI 53202 | Business Office: 414-347-7777 | Financial Professionals: 888-505-5180 | Individual Investors: 800-432-7856
In the prospectus dated 5/1/2026, the Net Fund Operating Expenses for the investor and institutional classes of the Mid Cap Value Fund are 1.10% and 0.85%, respectively. The Advisor has contractually agreed to waive its management fees and/or reimburse expenses of the Fund to ensure that Net Fund Operating Expenses for the Fund do not exceed 1.10% of the Fund’s average net assets for the investor class shares and 0.85% for the institutional class shares, through at least 4/5/2028, and subject thereafter to annual reapproval of the agreement by the Board of Directors. Without such waiver and/or reimbursements, the Gross Fund Operating Expenses would be 1.21% for the investor class shares and 0.95% for the institutional class shares.
Past performance does not guarantee future results. Performance represents past performance; current returns may be lower or higher. Performance for institutional class shares prior to their initial offering is based on the performance of investor class shares. The investment return and principal value will fluctuate so that an investor's shares, when redeemed, may be worth more or less than the original cost. All returns reflect reinvested dividends and capital gains distributions, but do not reflect the deduction of taxes that an investor would pay on distributions or redemptions. Subject to certain exceptions, shares of a Fund redeemed or exchanged within 10 days of purchase are subject to a 2% redemption fee. Performance does not reflect this fee, which if deducted would reduce an individual's return. To obtain performance through the most recent month end, call 800-432-7856 or visit heartlandadvisors.com.
An investor should consider the Funds’ investment objectives, risks, and charges and expenses carefully before investing or sending money. This and other important information may be found in the Funds' prospectus. To obtain a prospectus, please call 800-432-7856 or visit heartlandadvisors.com. Please read the prospectus carefully before investing.
As of 6/30/2025, Becton, Dickinson and Company (BDX), Everest Group LTD (EG), and Hubbell Inc (HUBB), represented 1.45%, 1.23%, and 1.28% of the Mid Cap Value Fund’s net assets, respectively.
Statements regarding securities are not recommendations to buy or sell.
Portfolio holdings are subject to change. Current and future portfolio holdings are subject to risk.
The Mid Cap Value Fund invests in a smaller number of stocks (generally 40 to 60) than the average mutual fund. The performance of these holdings generally will increase the volatility of the Fund’s returns. The Fund also invests in mid-sized companies on a value basis. Mid-sized securities generally are more volatile and less liquid than those of larger companies.
Value investments are subject to the risk that their intrinsic value may not be recognized by the broad market.
The Mid Cap Value Fund seeks long-term capital appreciation and modest current income.
The Fund’s performance information included in regulatory filings includes a required index that represents an overall securities market (Regulatory Benchmark). In addition, the Fund's regulatory filings may also include an index that more closely aligns to the Fund's investment strategy (Strategy Benchmark(s)). The Fund's performance included in marketing and advertising materials and information other than regulatory filings is generally compared only to the Strategy Benchmark.
The above individuals are registered representatives of ALPS Distributors, Inc.
The Heartland Funds are distributed by ALPS Distributors, Inc.
The statements and opinions expressed in this article are those of the presenter(s). Any discussion of investments and investment strategies represents the presenters’ views as of the date created and are subject to change without notice. The opinions expressed are for general information only and are not intended to provide specific advice or recommendations for any individual. The specific securities discussed, which are intended to illustrate the advisor’s investment style, do not represent all of the securities purchased, sold, or recommended by the advisor for client accounts, and the reader should not assume that an investment in these securities was or would be profitable in the future. Certain security valuations and forward estimates are based on Heartland Advisors’ calculations. Any forecasts may not prove to be true.
Economic predictions are based on estimates and are subject to change.
There is no guarantee that a particular investment strategy will be successful.
Sector and Industry classifications are sourced from GICS®.The Global Industry Classification Standard (GICS®) is the exclusive intellectual property of MSCI Inc. (MSCI) and S&P Global Market Intelligence (“S&P”). Neither MSCI, S&P, their affiliates, nor any of their third party providers (“GICS Parties”) makes any representations or warranties, express or implied, with respect to GICS or the results to be obtained by the use thereof, and expressly disclaim all warranties, including warranties of accuracy, completeness, merchantability and fitness for a particular purpose. The GICS Parties shall not have any liability for any direct, indirect, special, punitive, consequential or any other damages (including lost profits) even if notified of such damages.
Heartland Advisors defines market cap ranges by the following indices: micro-cap by the Russell Microcap®, small-cap by the Russell 2000®, mid-cap by the Russell Midcap®, large-cap by the Russell Top 200®.
Because of ongoing market volatility, performance may be subject to substantial short-term changes.
Dividends are not guaranteed and a company’s future ability to pay dividends may be limited. A company currently paying dividends may cease paying dividends at any time.
There is no assurance that dividend-paying stocks will mitigate volatility.
CFA® is a registered trademark owned by the CFA Institute.
Russell Investment Group is the source and owner of the trademarks, service marks and copyrights related to the Russell Indices. Russell® is a trademark of the Frank Russell Investment Group.
Data sourced from FactSet: Copyright 2026 FactSet Research Systems Inc., FactSet Fundamentals. All rights reserved.
Heartland’s investing glossary provides definitions for several terms used on this page.
Artificial intelligence (AI) is intelligence—perceiving, synthesizing, and inferring information—demonstrated by computers, as opposed to intelligence displayed by humans or by other animals. Bottom-up is an investment approach that de-emphasizes the significance of economic and market cycles. This approach focuses on the analysis of individual stocks and the investor focuses his or her attention on a specific company rather than on the industry in which that company operates or on the economy as a whole. The Composite Index of Leading Indicators, otherwise known as the Leading Economic Index (LEI), is an index published monthly by The Conference Board. It is used to predict the direction of global economic movements in future months. The Composite Index of Coincident Indicators is an index published by the Conference Board that provides a broad-based measurement of current economic conditions, helping economists, investors, and public policymakers to determine which phase of the business cycle the economy is currently experiencing. Cyclical Stocks cover Basic Materials, Capital Goods, Communications, Consumer Cyclical, Energy, Financial, Technology, and Transportation which tend to react to a variety of market conditions that can send them up or down and often relate to business cycles. Enterprise Value/Earnings Before Interest, Taxes, Depreciation, and Amortization (EV/EBITDA) Ratio is a financial indicator used to determine the value of a company and is calculated by dividing the entire economic value of the company (enterprise value) by its earnings before interest, taxes, depreciation, and amortization (EBITDA). Free Cash Flow is the amount of cash a company has after expenses, debt service, capital expenditures, and dividends. The higher the free cash flow, the stronger the company’s balance sheet. Free Cash Flow Yield is calculated as the amount of cash a company has after expenses, debt service, capital expenditures, and dividends divided by either its current market price per share or enterprise value. Momentum is the rate of acceleration of a security's price or trade volume. Return on Equity is a measure of the net income after taxes that a firm is able to earn as a percent of stockholders equity. Risk on/Risk off Theory is an investment setting in which price behavior responds to, and is driven by, changes in investor risk tolerance. Risk-on risk-off refers to changes in investment activity in response to global economic patterns. During periods when risk is perceived as low, risk-on risk-off theory states that investors tend to engage in higher-risk investments. When risk is perceived as high, investors have the tendency to gravitate toward lower-risk investments. Russell Investment Group is the source and owner of the trademarks, service marks and copyrights related to the Russell Indices. Russell® is a trademark of the Russell Investment Group. Russell Midcap® Index measures the performance of the 800 smallest companies in the Russell 1000® Index. All indices are unmanaged. It is not possible to invest directly in an index. Russell Midcap® Value Index measures the performance of those Russell Midcap® Index companies with lower price/book ratios and lower forecasted growth characteristics. All indices are unmanaged. It is not possible to invest directly in an index. S&P 500 Index is an index of 500 U.S. stocks chosen for market size, liquidity and industry group representation and is a widely used U.S. equity benchmark. All indices are unmanaged. It is not possible to invest directly in an index. Tangible Book Value is the sum of all of a company’s assets, minus its liabilities and intangible assets, such as goodwill. Volatility is a statistical measure of the dispersion of returns for a given security or market index which can either be measured by using the standard deviation or variance between returns from that same security or market index. Commonly, the higher the volatility, the riskier the security. Yield is the income return on an investment. 10 Principles of Value Investing™ consist of the following criteria for selecting securities: (1) catalyst for recognition; (2) low price in relation to earnings; (3) low price in relation to cash flow; (4) low price in relation to book value; (5) financial soundness; (6) positive earnings dynamics; (7) sound business strategy; (8) capable management and insider ownership; (9) value of company; and (10) positive technical analysis.


