See standardized performance at the end.
Howard Marks famously observed that “when most people think about the future, they ignore that the future is a distribution of possibilities.” The first quarter provided a clear illustration of this principle.
Early in the period, there were signs that market performance was broadening beyond companies most closely associated with AI. A much broader set of equities outperformed on several up and down market days during January and February, contributing to stronger relative returns in mid-cap indices. This trend reversed in March, as geopolitical tensions and the onset of conflict in Iran reintroduced volatility and prompted a shift toward larger companies, along with energy stocks and companies perceived to be relatively insulated from inflationary pressures.
In this environment of rapid rotation and elevated uncertainty, our use of four price targets is particularly relevant. For each investment, we define a base case, an upside scenario, a downside case, and a maximum downside scenario associated with more severe market stress.
Given current conditions—where enthusiasm surrounding AI remains elevated and risks are omnipresent, this framework provides a structured way to evaluate how securities are priced on a multi-year basis under different scenarios. Rather than relying on a single forecast, it allows us to assess whether price movements reflect changes in underlying fundamental prospects or short-term sentiment. During the quarter, this distinction was especially important as leadership shifted and valuation disparities widened even further in some cases. We believe that over time, fundamental drivers — and importantly the price paid for those fundamentals—will remain the primary determinants of long-term returns.
Beneath the surface, excitement surrounding artificial intelligence (AI) continues to foster an environment of extreme valuation disparity between perceived winners and losers of an AI infrastructure buildout and the associated implications of use cases proliferating across the global economy. Euphoria is typically born in truth (a positive business driver) and then over-extrapolated in valuation. Micron Technology (MU) is currently a major AI beneficiary due to surging demand for memory and storage. An observation of Micron Technology’s enterprise value to sales multiple provides one indication of where we are today. In just a few years, MU has seen its EV/sales multiple expand six-fold. MU is a “Deep Value” company, one which was a strong contributor to our portfolio in the 2023-24 timeframe. Despite very real revenue/margin drivers from AI demand, we expect the passage of time to prove that MU remains an extremely cyclical and capital-intensive company that still sells a commodity and can have violent swings in profitability.
None of that seems reflected in valuation today as MU trades at a significant premium to companies that have proven to have higher and more consistent profitability over time. Meanwhile, one can find “Deep Value” companies that are taking internal actions to improve their profitability and are priced with a greater potential margin of safety in their shares. One such example is Mohawk Industries (MHK), a flooring manufacturer. It is true that MHK’s end markets are cyclically depressed and that MHK will most certainly not benefit from a growth driver like AI. However, our point is that it doesn’t need a technological tsunami to present an attractive investment opportunity today with far less downside to its valuation if circumstances change.
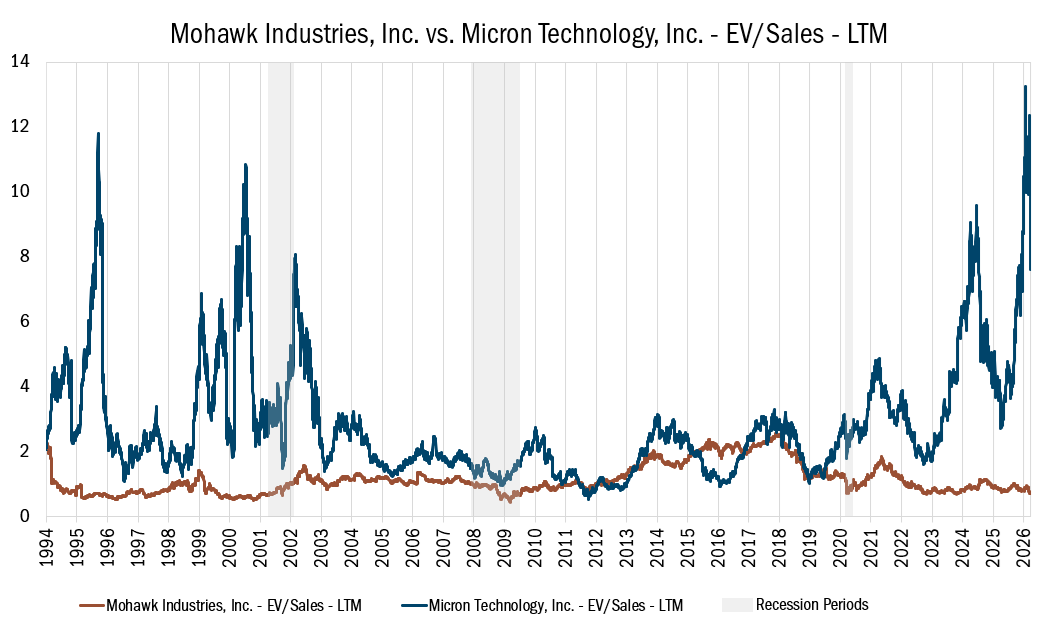
Source: FactSet Research Systems, Inc. Daily data 1/03/1994 to 3/24/2026. The data in this chart represents Mohawk Industries, Inc. enterprise value to sales verses Micron Technology, Inc. enterprise value to sales, including recession periods. Past performance does not guarantee future results.
Will the market continue to narrow into the obvious AI winners of today or will a broadening toward undervalued businesses resume? That’s difficult to say, just as it’s impossible to know when or if oil prices will revert to their pre-conflict levels. Rather than trying to predict the unpredictable, we focus on company-specific fundamentals while paying close attention to what’s within our control, most importantly, what we pay for a business and whether our decisions create the condition for a margin of safety.
The Mid Cap Value Fund gained 4.09% in the first quarter, outpacing the Russell Midcap® Value Index, which was up 3.68%. Outperformance was driven primarily by stock selection, with notable contributions from Financials, Consumer Discretionary, and Information Technology.
Our two-bucket approach has been particularly relevant in the current market environment. The portfolio maintains exposure to both higher-quality companies trading at attractive valuations (“Quality Value”) and more deeply discounted businesses taking internal actions to improve themselves (“Deep Value”).
In today’s market, where AI-driven enthusiasm continues to support select segments while leaving others at historically depressed valuations, this structure provides a balanced way to navigate uncertainty. Recent market behavior—characterized by sharp rotations and persistent valuation gaps—has reinforced the difficulty of predicting near-term leadership. Maintaining exposure to both segments allows the portfolio to remain adaptable without relying on a specific macroeconomic outcome.
During the first quarter, we continued to operate near the upper end of our historical Quality Value overweight. This reflects what we are finding on a bottom-up basis but is also consistent with the historically extreme underperformance of Quality Value described in our Q4 letter and bifurcated valuation backdrop of today. At the same time, we have selectively leaned into a few opportunities within Deep Value by increasing our position size. We would much rather do this in a targeted fashion than bet on the “rising tide” continuing for many Deep Value companies in midcap value that seem to be priced for “blue skies” today. Periods of higher volatility typically provide us with a wider opportunity set to raise our Deep Value weighting.
Utilities. Exelon Corp. (EXC), a transmission and distribution focused utility operating across multiple U.S. regions, represents a Deep Value utility holding that inflected positively versus peers during the quarter.
Exelon, which operates in Delaware, Illinois, Maryland, New Jersey, Pennsylvania, and Washington, D.C., doesn’t generate power. It owns and manages the transmission lines, local wires, and control systems that distribute that electricity. Thanks to its geography, it must work with PJM Interconnection, a regional transmission organization that runs wholesale markets and directs the flow of power for a large part of the Eastern United States. In our opinion, PJM is a flawed market where consumers are being squeezed with high prices. However, we believe that part of the solution represents a growing opportunity set for EXC in the form of higher transmission investment and eventually more state-regulated generation growth.
The company’s updated 5-year outlook provided the clearest evidence yet of this prospect becoming reality. Despite recent share price appreciation, the stock continues to trade at a discount to peers of comparable quality, and we consider the re-rating opportunity versus peers to be in the early stages.
![]()
Energy. One of our top contributors in the quarter was EOG Resources (EOG), a Quality Value oil and gas producer. EOG is a low-cost, high-return operator in a tough business. Before the Iran conflict escalated, EOG shares rose after the company disclosed additional details that quelled concerns regarding well productivity in its Permian Basin footprint and provided evidence of ample remaining low-cost inventory. Meanwhile, EOG continues to reach new milestones in its portfolio of attractive domestic and international growth assets. This is all happening while the company is aggressively returning cash to shareholders via dividends and share repurchases.
Geopolitical factors have certainly helped turbocharge EOG shares recently, along with the broader oil and gas industry. However, compared to other upstream energy producers, we are most intrigued by the company’s elite track record in exploration and development combined with tangible evidence that it is repeating a similar playbook to what built the company into a premier operator. Even after the recent run, shares trade at just 6x EV/EBITDA.
![]()
Consumer Discretionary. During the quarter, we added a new holding in Murphy USA (MUSA), a large-scale, low-cost operator of gas stations and convenience stores throughout the country.
Until recently, the relatively modest absolute level and volatility of gasoline prices created a challenging backdrop for “everyday low price” fuel retailers like Murphy. Shortly after we initiated a position, the stock jumped as the return of higher gas prices, driven by the conflict in Iran, allowed MUSA to flex its low-cost advantage, offering everyday discounted prices to consumers seeking value. Ultimately, how low-cost leaders respond in a trough speaks to their resilience and ability to emerge as winners when the cycle normalizes. We believe Murphy has done just that, and management seems to know it, as they have been buying back shares along the way.
We can’t predict exactly how this cycle will unfold. What we do know, though, is that MUSA’s long-term margin opportunity is attractive, especially when more than 60% of its industry peers are independents who generally have difficulty competing in an inflationary backdrop. The stock—which traded at a 10-30% discount to the S&P 1500 Food and Staples group during the prior cycle—was recently at an all-time discount to peers of 45%. The company’s structural share gains and attractive valuation gave us confidence to purchase shares despite no certainty that fuel margins would improve. Thus far, our timing has proven lucky, but this situation serves as a reminder that buying a good business at an attractive valuation is more important than trying to predict the unpredictable, in this case, the price of fuel.
Unpredictable swings in the market like we witnessed in the first quarter reinforce our belief in Heartland’s process. We do not attempt to predict or chase short-term shifts in the market. Instead, we focus on identifying durable businesses trading at attractive prices with a potential built-in margin of safety. While a return to early-year market broadening isn’t certain, we believe the current environment is laying the groundwork for patient and disciplined value investors. In the meantime, we continue to plan for a range of possible outcomes to manage risks and identify long-term opportunities.
Scroll over to view complete data
| Since Inception (%) | 20-Year (%) | 15-Year (%) | 10-Year (%) | 5-Year (%) | 3-Year (%) | 1-Year (%) | YTD* (%) | QTD* (%) | |
|---|---|---|---|---|---|---|---|---|---|
| Mid Cap Value | 8.85 | -- | -- | 10.13 | 6.61 | 7.60 | 14.02 | 14.39 | 9.90 |
| Mid Cap Value | 9.13 | -- | -- | 10.40 | 6.87 | 7.88 | 14.22 | 14.54 | 9.99 |
| Russell Midcap® Value | 9.59 | 9.20 | 10.98 | 10.63 | 9.48 | 16.51 | 26.62 | 17.58 | 13.40 |
*Not annualized
Source: FactSet Research Systems Inc., Russell®, and Heartland Advisors, Inc.
The inception date for the Mid Cap Value Fund is 10/31/2014 for the investor and institutional class.
In the prospectus dated 5/1/2026, the Net Fund Operating Expenses for the investor and institutional classes of the Mid Cap Value Fund are 1.10% and 0.85%, respectively. The Advisor has contractually agreed to waive its management fees and/or reimburse expenses of the Fund to ensure that Net Fund Operating Expenses for the Fund do not exceed 1.10% of the Fund’s average net assets for the investor class shares and 0.85% for the institutional class shares, through at least 4/5/2028, and subject thereafter to annual reapproval of the agreement by the Board of Directors. Without such waiver and/or reimbursements, the Gross Fund Operating Expenses would be 1.21% for the investor class shares and 0.95% for the institutional class shares.
Past performance does not guarantee future results. Performance represents past performance; current returns may be lower or higher. Performance for institutional class shares prior to their initial offering is based on the performance of investor class shares. The investment return and principal value will fluctuate so that an investor's shares, when redeemed, may be worth more or less than the original cost. All returns reflect reinvested dividends and capital gains distributions, but do not reflect the deduction of taxes that an investor would pay on distributions or redemptions. Subject to certain exceptions, shares of a Fund redeemed or exchanged within 10 days of purchase are subject to a 2% redemption fee. Performance does not reflect this fee, which if deducted would reduce an individual's return. To obtain performance through the most recent month end, call 800-432-7856 or visit heartlandadvisors.com.
©2026 Heartland Advisors | 790 N. Water Street, Suite 1200, Milwaukee, WI 53202 | Business Office: 414-347-7777 | Financial Professionals: 888-505-5180 | Individual Investors: 800-432-7856
In the prospectus dated 5/1/2026, the Net Fund Operating Expenses for the investor and institutional classes of the Mid Cap Value Fund are 1.10% and 0.85%, respectively. The Advisor has contractually agreed to waive its management fees and/or reimburse expenses of the Fund to ensure that Net Fund Operating Expenses for the Fund do not exceed 1.10% of the Fund’s average net assets for the investor class shares and 0.85% for the institutional class shares, through at least 4/5/2028, and subject thereafter to annual reapproval of the agreement by the Board of Directors. Without such waiver and/or reimbursements, the Gross Fund Operating Expenses would be 1.21% for the investor class shares and 0.95% for the institutional class shares.
Past performance does not guarantee future results. Performance represents past performance; current returns may be lower or higher. Performance for institutional class shares prior to their initial offering is based on the performance of investor class shares. The investment return and principal value will fluctuate so that an investor's shares, when redeemed, may be worth more or less than the original cost. All returns reflect reinvested dividends and capital gains distributions, but do not reflect the deduction of taxes that an investor would pay on distributions or redemptions. Subject to certain exceptions, shares of a Fund redeemed or exchanged within 10 days of purchase are subject to a 2% redemption fee. Performance does not reflect this fee, which if deducted would reduce an individual's return. To obtain performance through the most recent month end, call 800-432-7856 or visit heartlandadvisors.com.
An investor should consider the Funds’ investment objectives, risks, and charges and expenses carefully before investing or sending money. This and other important information may be found in the Funds' prospectus. To obtain a prospectus, please call 800-432-7856 or visit heartlandadvisors.com. Please read the prospectus carefully before investing.
As of 3/31/2026, EOG Resources (EOG), Exelon Corp. (EXC), Mohawk Industries (MHK), Murphy USA (MUSA), represented 3.90%, 3.87%, 0.99% and 1.99% of the Mid Cap Value Fund’s net assets, respectively. Micron Technology (MU) is unowned by Heartland Advisors.
Statements regarding securities are not recommendations to buy or sell.
Portfolio holdings are subject to change. Current and future portfolio holdings are subject to risk.
The Mid Cap Value Fund invests in a smaller number of stocks (generally 40 to 60) than the average mutual fund. The performance of these holdings generally will increase the volatility of the Fund’s returns. The Fund also invests in mid-sized companies on a value basis. Mid-sized securities generally are more volatile and less liquid than those of larger companies.
Value investments are subject to the risk that their intrinsic value may not be recognized by the broad market.
The Mid Cap Value Fund seeks long-term capital appreciation and modest current income.
The Fund’s performance information included in regulatory filings includes a required index that represents an overall securities market (Regulatory Benchmark). In addition, the Fund's regulatory filings may also include an index that more closely aligns to the Fund's investment strategy (Strategy Benchmark(s)). The Fund's performance included in marketing and advertising materials and information other than regulatory filings is generally compared only to the Strategy Benchmark.
The above individuals are registered representatives of ALPS Distributors, Inc.
The Heartland Funds are distributed by ALPS Distributors, Inc.
The statements and opinions expressed in this article are those of the presenter(s). Any discussion of investments and investment strategies represents the presenters’ views as of the date created and are subject to change without notice. The opinions expressed are for general information only and are not intended to provide specific advice or recommendations for any individual. The specific securities discussed, which are intended to illustrate the advisor’s investment style, do not represent all of the securities purchased, sold, or recommended by the advisor for client accounts, and the reader should not assume that an investment in these securities was or would be profitable in the future. Certain security valuations and forward estimates are based on Heartland Advisors’ calculations. Any forecasts may not prove to be true.
Economic predictions are based on estimates and are subject to change.
There is no guarantee that a particular investment strategy will be successful.
Sector and Industry classifications are sourced from GICS®.The Global Industry Classification Standard (GICS®) is the exclusive intellectual property of MSCI Inc. (MSCI) and S&P Global Market Intelligence (“S&P”). Neither MSCI, S&P, their affiliates, nor any of their third party providers (“GICS Parties”) makes any representations or warranties, express or implied, with respect to GICS or the results to be obtained by the use thereof, and expressly disclaim all warranties, including warranties of accuracy, completeness, merchantability and fitness for a particular purpose. The GICS Parties shall not have any liability for any direct, indirect, special, punitive, consequential or any other damages (including lost profits) even if notified of such damages.
Heartland Advisors defines market cap ranges by the following indices: micro-cap by the Russell Microcap®, small-cap by the Russell 2000®, mid-cap by the Russell Midcap®, large-cap by the Russell Top 200®.
Because of ongoing market volatility, performance may be subject to substantial short-term changes.
Dividends are not guaranteed and a company’s future ability to pay dividends may be limited. A company currently paying dividends may cease paying dividends at any time.
There is no assurance that dividend-paying stocks will mitigate volatility.
CFA® is a registered trademark owned by the CFA Institute.
Russell Investment Group is the source and owner of the trademarks, service marks and copyrights related to the Russell Indices. Russell® is a trademark of the Frank Russell Investment Group.
Data sourced from FactSet: Copyright 2026 FactSet Research Systems Inc., FactSet Fundamentals. All rights reserved.
Heartland’s investing glossary provides definitions for several terms used on this page.
Artificial intelligence (AI) is intelligence—perceiving, synthesizing, and inferring information—demonstrated by computers, as opposed to intelligence displayed by humans or by other animals. Cyclical Stocks cover Basic Materials, Capital Goods, Communications, Consumer Cyclical, Energy, Financial, Technology, and Transportation which tend to react to a variety of market conditions that can send them up or down and often relate to business cycles. Free Cash Flow is the amount of cash a company has after expenses, debt service, capital expenditures, and dividends. The higher the free cash flow, the stronger the company’s balance sheet. Free Cash Flow Yield is calculated as the amount of cash a company has after expenses, debt service, capital expenditures, and dividends divided by either its current market price per share or enterprise value. Leverage is the amount of debt used to finance a firm's assets. A firm with significantly more debt than equity is considered to be highly leveraged. Momentum is the rate of acceleration of a security's price or trade volume. Relative Value is a method of determining an asset's value that takes into account the value of similar assets. Calculations that are used to measure the relative value of stocks include the enterprise ratio and price-to-earnings ratio. Russell Midcap® Value Index measures the performance of those Russell Midcap® Index companies with lower price/book ratios and lower forecasted growth characteristics. All indices are unmanaged. It is not possible to invest directly in an index. Upside Capture/Downside Capture vs. Market is a measure used to evaluate how well a manager or index performed (gained more or lost less) relative to another index during periods when that index rose or fell. Market is defined as the X Index. Volatility is a statistical measure of the dispersion of returns for a given security or market index which can either be measured by using the standard deviation or variance between returns from that same security or market index. Commonly, the higher the volatility, the riskier the security. 10 Principles of Value Investing™ consist of the following criteria for selecting securities: (1) catalyst for recognition; (2) low price in relation to earnings; (3) low price in relation to cash flow; (4) low price in relation to book value; (5) financial soundness; (6) positive earnings dynamics; (7) sound business strategy; (8) capable management and insider ownership; (9) value of company; and (10) positive technical analysis.


