While the overall stock market started to broaden in the fourth quarter, the same couldn’t be said for mid-caps. Despite brief stretches of broadening performance across market caps, large- and mega-cap stocks logged another quarter of outperformance.
Within the mid-cap value space, a combination of speculative, lower quality and momentum-driven parts of the market have garnered significant attention lately and continued to lead. At the same time, the higher quality segment of mid-cap value lagged, even though that group has historically outperformed more speculative fare (see the charts below).
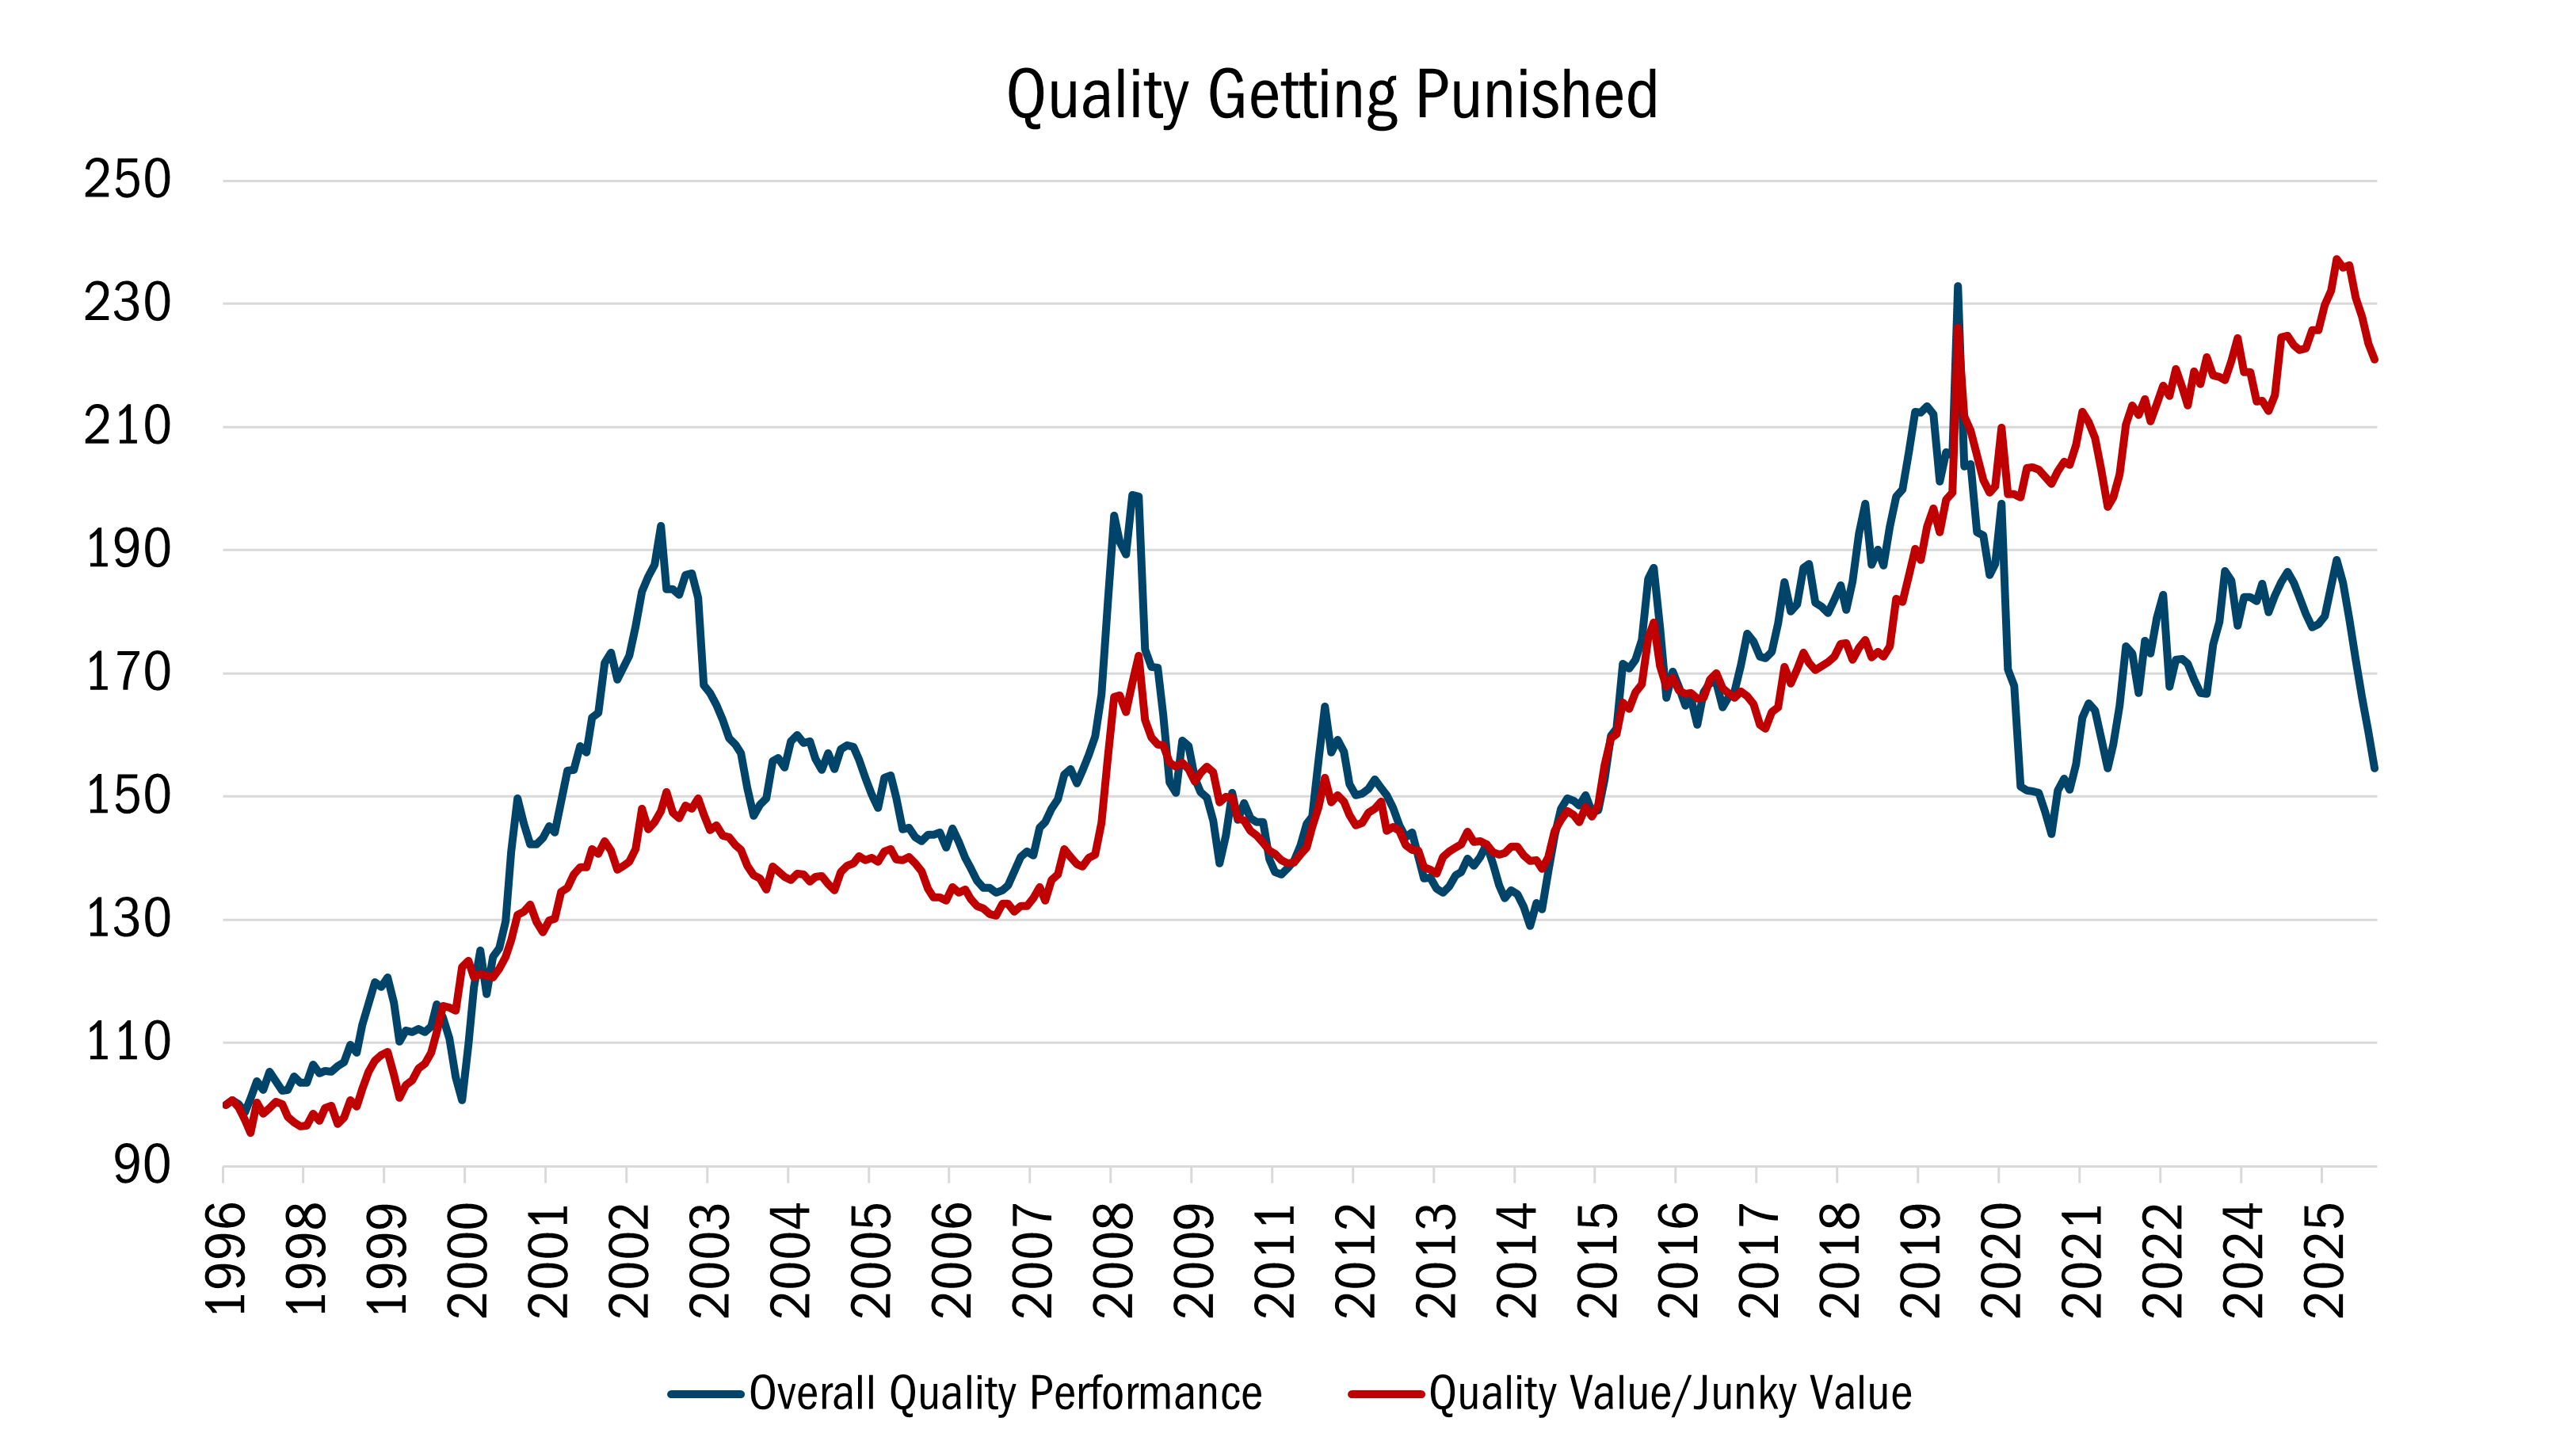
Source: The Leuthold Group. Monthly data from 12/31/1996 to 10/31/2025. The data in this chart shows the comparison of Quality Performance to Quality/Junky Value over time. All performance and return numbers are based on monthly rebalancing and members are equal-weighted. Value is a composite that consists of P/E, P/Sales, P/book and this factor is ranked across the largest 1500 stock universe and the cheapest quintile is considered Value. Quality is defined by 3 factors: ROE, Leverage (debt/assets) and operational (sales and earnings) stability. Then, ranked the largest 1500 US stocks by this composite 3-factor quality rank. The top quintile is high quality and bottom quintile low quality. Quality Value is defined as the cheapest stocks that are also in the top 2 quintiles of the quality rank. Junky Value is defined as the cheapest quintile stocks that are also in the bottom 3 quintiles of the quality rank. All indices are unmanaged. It is not possible to invest directly in an index. Past performance does not guarantee future results.
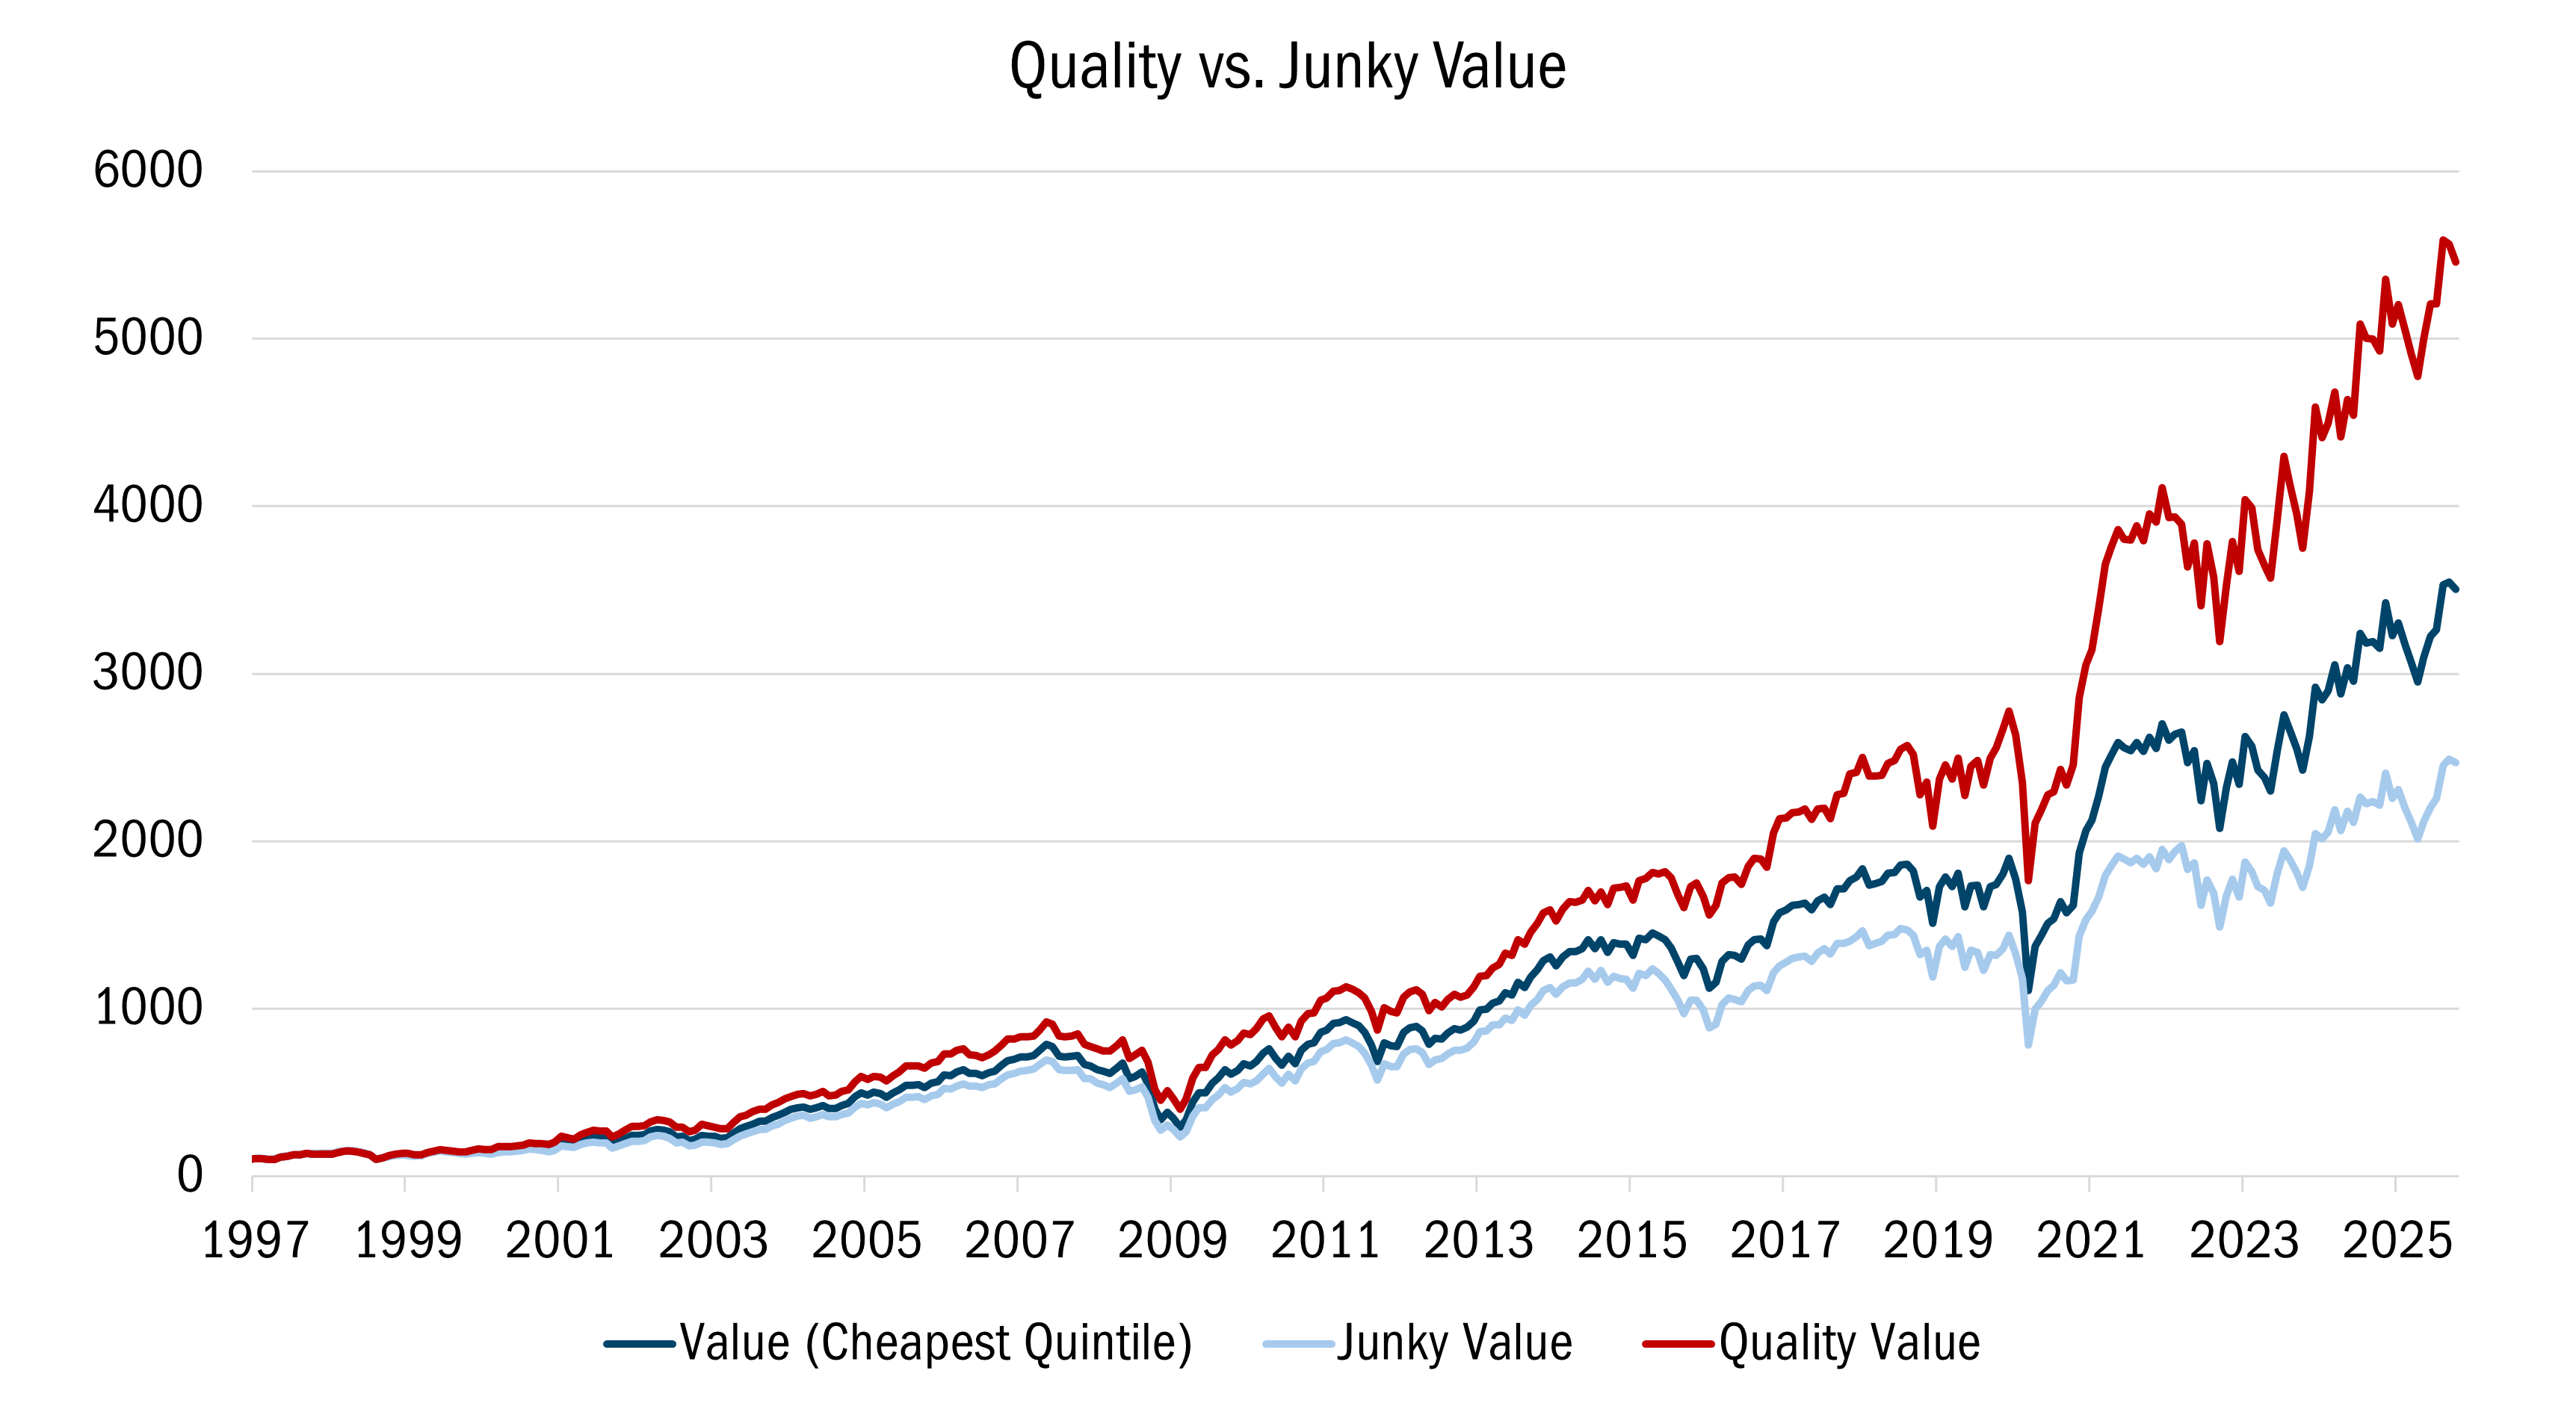
Source: The Leuthold Group monthly data from 12/31/1996 to 10/31/2025. The data in this chart shows the comparison of Quality Value to Junky Value over time. All performance and return numbers are based on monthly rebalancing and members are equal-weighted. Value is a composite that consists of P/E, P/Sales, P/book and this factor is ranked across the largest 1500 stock universe and the cheapest quintile is considered Value. Quality is defined by 3 factors: ROE, Leverage (debt/assets) and operational (sales and earnings) stability. Then, ranked the largest 1500 US stocks by this composite 3-factor quality rank. The top quintile is high quality and bottom quintile low quality. Quality Value is defined as the cheapest stocks that are also in the top 2 quintiles of the quality rank. Junky Value is defined as the cheapest quintile stocks that are also in the bottom 3 quintiles of the quality rank. All indices are unmanaged. It is not possible to invest directly in an index. Past performance does not guarantee future results.
The valuation disparity between these two groups is now as wide as we have ever seen. Against that backdrop, we have witnessed significant C-suite and director buying of shares in more than twenty of our portfolio companies. This contrasts with rampant insider selling taking place in companies with far rosier expectations priced into their shares, a possible reflection of how corporate insiders view risk/reward in their companies.
Speculative investors have confidently rewarded perceived AI winners with lofty valuations, seeming to assign a degree of permanence to top line benefits that have a questionable duration. Within mid cap value, the euphoria has impacted valuations in many “Quality Value” and “Deep Value” companies, more than one might expect in a value-oriented asset class. However, we have been particularly struck by the degree to which the rising tide has levitated Deep Value stocks in a wide range of industries. Only time will tell whether fundamentals prove strong enough for long enough to justify these valuations, but we are skeptical. We make that observation with a healthy respect for the significant contributions AI can have on the future economic landscape and a belief that value investors can assess longer term AI-related benefits for companies that go beyond selling chips and building datacenters.
Our Strategy is built around our “two-bucket” approach. At all times, we seek to hold both high quality mid-cap companies (“Quality Value”) trading at bargains and deeply discounted mid-sized businesses that have produced poor economic returns over time, which we call “Deep Value”. We do this because each style within value takes turns outperforming, just as growth and value strategies generally alternate leading the market. We don’t know with certainty which style of value will lead in any quarter or year.
All of this is done with a valuation overlay that considers a range of possible outcomes, rather than just the optimistic ones. These include a base case, a ‘blue sky’ scenario, a ‘downside’ scenario should circumstances worsen, and a ‘max downside’ case in the event of a potential shock. At the end of the day, we are disciplined, bottom-up value investors. To stay true to essential fundamental considerations such as financial soundness, positive earnings dynamics, and attractive valuations based on profits, book value, and cash flow, we rely on our 10 Principles of Value Investing™.
The Mid Cap Value Strategy lost 1.72% in the fourth quarter, trailing the Russell Midcap® Value Index, which was up 1.42%. Stock selection was responsible for most of our underperformance, as our selection effect was particularly negative in Health Care, Information Technology, and Consumer Discretionary. The fact that our Quality Value holdings lagged, for the reasons stated earlier, contributed to our underperformance. So, too, did the fact that we’re at the higher end of our historical overweight to “Quality Value”.
Over time, we carry self-imposed upper and lower bands to help ensure adequate exposure to both buckets. We are near the upper band for Quality Value based on how historically cheap this segment has been and the stock-specific valuation merits in each bucket. This hurt our performance in the quarter, but in the long run we remain confident.
In a few cases, our self-help catalysts have either been slow to materialize or fell victim to questionable capital allocation decisions by the C-suite (like the Kimberly-Clark example).
![]()
Industrials. One area of encouragement is Industrials where J.B. Hunt Transport Servies (JBHT) was our top contributor in the sector and for our portfolio in the quarter.
J.B. Hunt, which falls into the Deep Value bucket, is a diversified transportation company focusing on intermodal shipping. Customers hire Hunt to move freight using different methods of transportation to reduce cost. The company owns the largest fleet of 53-foot shipping containers, which allow for three ocean-freight shipping units to be consolidated into two Hunt containers that can then be moved by rail and company-owned trucks. Hunt’s “mode agnostic” approach sets it apart from the competition, as does its size. JBHT’s intermodal business is roughly twice as big as the next largest competitor, resulting in a scale and cost advantage that has produced high returns on capital and better prices for customers.
In recent years, the freight market has been put through the wringer, as supply chains during and after the pandemic experienced a tremendous amount of volatility. In Q3, however, Hunt beat analysts’ forecasts, owing to recent actions to reduce costs. Management’s focus on improving areas that they can control seems to be working, as operating margins for JBHT’s intermodal segment expanded by 100 basis points year over year, despite fewer loads shipped in the quarter.
While managing through a freight recession, cash flow generation remains strong, the company’s balance sheet is in fantastic shape with a leverage ratio of less than 1x, and management has been aggressively repurchasing company stock below our view of intrinsic value. In 2025, the company bought back more than 5% of the shares outstanding.
JBHT currently trades at 11.8 times consensus next 12-month EV/EBITDA, which represents a 25% discount to the Industrial sector. Earnings expectations over the next 12 months have fallen 30% from prior cycle peak levels, though, Hunt typically trades at a premium when earnings bottom.
![]()
Financials. In the quarter, we initiated a new position in MarketAxess Holdings (MKTX), a Quality Value company that owns and operates the largest e-trading platform in the U.S. for corporate bonds.
Bonds are largely traded over the counter, unlike equities or listed derivatives, which are traded on exchanges. Operating a trading platform is all about scale, where volume determines profitability. Rising customer activity can be a virtuous circle that begets more trading as depth of liquidity improves for all platform participants. Improved liquidity, in turn, drives down trading costs, which then attracts even more volume. Scaled trading platforms can be extremely profitable. MKTX’s operating margin, for example, exceeds 40% while gross margin can exceed 75%.
Though MarketAxess pioneered electronic bond trading, prior management rested on their laurels as peers launched new trading protocols that gained market share. MKTX’s bread and butter is providing leading market depth in single-bond trading. But the industry has witnessed the rapid adoption of “portfolio trading” (PT), where asset owners can bundle a portfolio of bonds and receive better pricing versus trading on a bond-by-bond basis. Tight corporate bonds credit spreads as of late have exacerbated the shift to PT.
CEO Chris Concannon has led a multi-year initiative to invest in a competing PT product among other value-added tools being launched by MKTX. Management has chosen not to wait for a better market environment to advance their efforts. As a result of this push, the company’s operating margin declined to around 41% last year, down from more than 45% in 2022.
We have been encouraged by recent trading data that suggest MKTX is gaining share in key areas of the U.S. credit market, with share recovery happening even faster than we expected. Looking forward, moderating investment spend should result in better operating leverage. We also believe the company’s international and emerging markets businesses, where electronic trading penetration is lower than in the U.S., have significant growth opportunity and scale advantages.
When we purchased the stock in the fourth quarter, MarketAxess was trading at 12.6 times consensus EV/EBITDA estimates for 2026. Since then, the multiple has expanded to 13.7 times. This is still favorable to the company’s domestic exchange peers, who are trading at a median multiple of 16.6 times, despite MKTX’s superior profit margins and balance sheet.
![]()
Consumer Staples. One holding that ran into difficulties last quarter is Kimberly Clark (KMB), the tissue company behind well-known brands such as Huggies, Cottonelle, and Kleenex.
The consumer products giant saw its shares fall more than 14% in November, not because of poor results or sub-par execution. Instead, the stock sank immediately after KMB announced its $48.7 billion acquisition of Kenvue, the consumer health company spun off from Johnson & Johnson which sells Tylenol, Neutrogena, Band-Aid and Listerine. We disagree with management’s capital allocation decision, as it takes KMB into new categories and poses significant integration risk. We find it unfortunate that management made such an aggressive move after executing well against an internally focused playbook that positioned KMB for value creation in the coming years. We fear that the Kenvue deal makes the company “bigger, not necessarily better”.
We trimmed the position in response to the Kenvue announcement. However, we balance deal-related question marks against a valuation of 13 times earnings (a historically wide discount to peers), better market share trends and improved margin performance in recent years.
We believe this is time for discipline, not discouragement. Valuations for many companies in the higher quality part of mid-cap value market are as appealing, relative to Deep Value, as we’ve ever seen. Having said that, we have been investing long enough to know that just because something should happen doesn’t mean it will — at least not immediately. In the current backdrop, we think it’s especially useful to seek a margin of safety through valuation discipline, financial soundness and qualitative assessment. History has shown that prioritizing valuation and balance sheet attributes can be most beneficial when others are less concerned with them. Today, we see valuation disparities across mid cap value companies that can prove beneficial in a wide range of future scenarios, not just the rosy outcomes.
Scroll over to view complete data
Source: FactSet Research Systems Inc., Russell Investment Group, and Heartland Advisors, Inc.
*Yearly and quarterly returns are not annualized. The Strategy's inception date is 9/30/1996.
The US Dollar is the currency used to express performance. Returns are presented net of advisory fees and net of bundled fees and include the reinvestment of all income.
©2026 Heartland Advisors | 790 N. Water Street, Suite 1200, Milwaukee, WI 53202 | Business Office: 414-347-7777 | Financial Professionals: 888-505-5180 | Individual Investors: 800-432-7856
Past performance does not guarantee future results.
The Mid Cap Value Strategy seeks long-term capital appreciation by investing in mid-size companies as defined by the market capitalization range of the Russell Midcap® Index. This focused portfolio seeks companies with strong underlying business franchises priced at a discount to their intrinsic worth that have temporarily fallen out of favor.
The Mid Cap Value Strategy invests in mid–sized companies on a value basis. Mid-sized securities generally are more volatile and less liquid than those of larger companies.
Value investments are subject to the risk that their intrinsic value may not be recognized by the broad market.
As of 12/31/2025, Heartland Advisors on behalf of its clients held approximately 0.10%, 0.03%, and 0.08% of the total shares outstanding of JB Hunt Transport Services (JBHT), Kimberly-Clark Corp (KMB) and MarketAccess Holding Inc. (MKTX) respectively.
The future performance of any specific investment or strategy (including the investments discussed above) should not be assumed to be profitable or equal to past results. The performance of the holdings discussed above may have been the result of unique market circumstances that are no longer relevant. The holdings identified above do not represent all of the securities purchased, sold or recommended for the Advisor’s clients.
Statements regarding securities are not recommendations to buy or sell.
Portfolio holdings are subject to change. Current and future portfolio holdings are subject to risk.
In certain cases, dividends and earnings are reinvested.
GIPS® is a registered trademark of CFA Institute. CFA Institute does not endorse or promote this organization, nor does it warrant the accuracy or quality of the content contained herein.
Separately managed accounts and related investment advisory services are provided by Heartland Advisors, Inc., a federally registered investment advisor. ALPS Distributors, Inc., is not affiliated with Heartland Advisors, Inc.
The statements and opinions expressed in this article are those of the presenter(s). Any discussion of investments and investment strategies represents the presenters’ views as of the date created and are subject to change without notice. The opinions expressed are for general information only and are not intended to provide specific advice or recommendations for any individual. The specific securities discussed, which are intended to illustrate the advisor’s investment style, do not represent all of the securities purchased, sold, or recommended by the advisor for client accounts, and the reader should not assume that an investment in these securities was or would be profitable in the future. Certain security valuations and forward estimates are based on Heartland Advisors’ calculations. Any forecasts may not prove to be true.
Economic predictions are based on estimates and are subject to change.
There is no guarantee that a particular investment strategy will be successful.
Sector and Industry classifications are sourced from GICS®.The Global Industry Classification Standard (GICS®) is the exclusive intellectual property of MSCI Inc. (MSCI) and S&P Global Market Intelligence (“S&P”). Neither MSCI, S&P, their affiliates, nor any of their third party providers (“GICS Parties”) makes any representations or warranties, express or implied, with respect to GICS or the results to be obtained by the use thereof, and expressly disclaim all warranties, including warranties of accuracy, completeness, merchantability and fitness for a particular purpose. The GICS Parties shall not have any liability for any direct, indirect, special, punitive, consequential or any other damages (including lost profits) even if notified of such damages.
Heartland Advisors defines market cap ranges by the following indices: micro-cap by the Russell Microcap®, small-cap by the Russell 2000®, mid-cap by the Russell Midcap®, large-cap by the Russell Top 200®.
Because of ongoing market volatility, performance may be subject to substantial short-term changes.
Dividends are not guaranteed and a company’s future ability to pay dividends may be limited. A company currently paying dividends may cease paying dividends at any time.
There is no assurance that dividend-paying stocks will mitigate volatility.
CFA® is a registered trademark owned by the CFA Institute.
Russell Investment Group is the source and owner of the trademarks, service marks and copyrights related to the Russell Indices. Russell® is a trademark of the Frank Russell Investment Group.
Data sourced from FactSet: Copyright 2025 FactSet Research Systems Inc., FactSet Fundamentals. All rights reserved.
Heartland’s investing glossary provides definitions for several terms used on this page.
Artificial intelligence (AI) is intelligence—perceiving, synthesizing, and inferring information—demonstrated by computers, as opposed to intelligence displayed by humans or by other animals. Cyclical Stocks cover Basic Materials, Capital Goods, Communications, Consumer Cyclical, Energy, Financial, Technology, and Transportation which tend to react to a variety of market conditions that can send them up or down and often relate to business cycles. Free Cash Flow is the amount of cash a company has after expenses, debt service, capital expenditures, and dividends. The higher the free cash flow, the stronger the company’s balance sheet. Free Cash Flow Yield is calculated as the amount of cash a company has after expenses, debt service, capital expenditures, and dividends divided by either its current market price per share or enterprise value. Leverage is the amount of debt used to finance a firm's assets. A firm with significantly more debt than equity is considered to be highly leveraged. Momentum is the rate of acceleration of a security's price or trade volume. Relative Value is a method of determining an asset's value that takes into account the value of similar assets. Calculations that are used to measure the relative value of stocks include the enterprise ratio and price-to-earnings ratio. Russell Midcap® Value Index measures the performance of those Russell Midcap® Index companies with lower price/book ratios and lower forecasted growth characteristics. All indices are unmanaged. It is not possible to invest directly in an index. Upside Capture/Downside Capture vs. Market is a measure used to evaluate how well a manager or index performed (gained more or lost less) relative to another index during periods when that index rose or fell. Market is defined as the X Index. Volatility is a statistical measure of the dispersion of returns for a given security or market index which can either be measured by using the standard deviation or variance between returns from that same security or market index. Commonly, the higher the volatility, the riskier the security. 10 Principles of Value Investing™ consist of the following criteria for selecting securities: (1) catalyst for recognition; (2) low price in relation to earnings; (3) low price in relation to cash flow; (4) low price in relation to book value; (5) financial soundness; (6) positive earnings dynamics; (7) sound business strategy; (8) capable management and insider ownership; (9) value of company; and (10) positive technical analysis.


