Market sentiment has been volatile, with significant shifts each quarter, and the past three months were no exception. Investors who entered April consumed with the risks of a global trade war began discounting an entirely new set of assumptions by the end of June as the Trump administration agreed to temporarily reduce China tariffs from an embargo-like 125% to a base reciprocal rate of 10% for 90 days, and China followed in lowering headline trade barriers. The prevailing narrative now appears to be that worries over a tariff-induced downturn may have been overblown.
As recession fears eased, investors re-embraced risk in the second quarter, pushing the Russell 3000® Index up 10.99%. Still, there were pockets of the market pricing in worse outcomes than the headline index would suggest. For example, the Russell 2000® Index gained a more modest 8.50%, trailing the S&P 500’s 10.94%. High-quality small companies underperformed both low-quality small caps and large-cap stocks, lagging the former by 233 basis points and the latter by 122 bps in the quarter. Small caps typically sharply outperform in a sustained equity market recovery, but year-to-date underperformance was sizeable at the end of both the first and second quarters.
As value investors, our job is to decipher price from value. The adage “you get what you pay for” often holds true in investing just as it does when shopping for clothes or a car. The cheapest item may not be the best value. Our work involves sifting through a multitude of statistically cheap securities to find a few gems. We understand that the market is frequently correct in its assessment that low-multiple securities are less expensive for a reason. In many instances, we find that these securities are significantly overvalued due to declining business value.
Today, we believe investors aren’t getting what they pay for. In fact, higher-quality businesses with higher profit margins and returns on capital are often cheaper than their lower-quality counterparts. Over the past 20 years, high-quality small caps have traded at a 5% premium to the S&P 500. Today, they’re sitting at a 10%-plus discount, based on forward Enterprise Value/EBIT. And while valuations for high-quality small stocks have historically been 15% cheaper than for low-quality small caps, that discount has grown to 30%. The opportunity set seems to be expanding for active, value-minded managers like us, particularly among early-cycle cyclicals and small caps, which are currently pricing in weaker future economic growth.
The performance of small-cap stocks presents an interesting case study on what the market is suggesting. Typically, their outperformance, as measured by the Russell 2000® Value Index versus large caps in the Russell 1000® Value Index, aligns with improving economic data, such as an increase in manufacturing activity as measured by the ISM Manufacturing New Orders Index (see the chart below). While manufacturing activity seems to be stabilizing, small caps have been sharply underperforming.
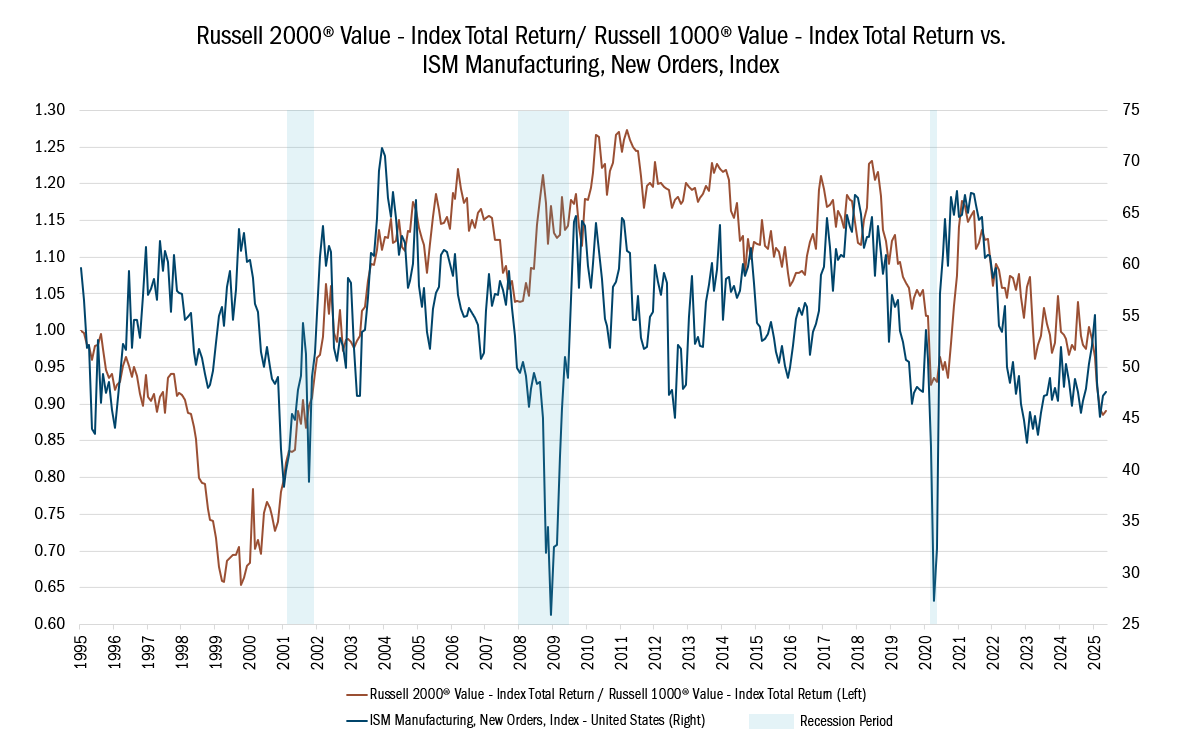
Source: FactSet Research Systems Inc., 1/31/1995 to 5/30/2025. This chart represents the Russell 2000® Value Index Total Return/ Russell 1000® Value Index Total Return verses the ISM Manufacturing, New Orders, Index. Russell 1000® Index measures the performance of the large-cap segment of the U.S. equity universe. It is a subset of the Russell 3000® Index and includes approximately 1000 of the largest securities based on a combination of their market cap and current index membership. The Russell 1000® represents approximately 92% of the U.S. market. Russell 2000® Index includes the 2000 firms from the Russell 3000® Index with the smallest market capitalizations. All indices are unmanaged. It is not possible to invest directly in an index. ISM Manufacturing Index is based on surveys of more than 300 manufacturing firms by the Institute of Supply Management. The ISM Manufacturing Index monitors employment, production inventories, new orders and supplier deliveries. A composite diffusion index is created that monitors conditions in national manufacturing based on the data from these surveys. All indices are unmanaged. It is not possible to invest directly in an index. Past performance does not guarantee future results.
Are investors sending a signal? It’s hard to say, but fiscal policy uncertainties remain, and we do not believe the final level or ultimate impact of tariffs has been settled. While recent economic data has been solid, it’s possible that figures through June reflect spending that was pulled forward by consumers and businesses anticipating price increases associated with tariffs.
Different segments of the market are sending mixed messages. In areas like transportation and housing, there continues to be a fair amount of consternation over policy uncertainties. Yet in other industries, like capital markets and commercial engineering & construction, the market is pricing in little to no risk of economic disruption from tariffs. There is one thing to be certain of: The margin of safety has diminished in many cases. As we seek to be opportunistic, we are mindful of this fact and are approaching this market with a healthy dose of caution, guided by our 10 Principles of Value Investing™, which directs us to attractively priced, financially sound, and well-managed businesses that can grow intrinsic value over time.
Attribution Analysis
During the quarter, our Strategy gained 1.17%, trailing the Russell 3000® Value Index, which was up 3.84%. Stock selection was negative in 7 of the 11 sectors, led by Industrials and Financials.
Our underweight to electrical infrastructure, a group recently bid up as an indirect play on the proliferation of artificial intelligence, was a key reason for our underperformance in the Industrial sector. Within Financials, we were hurt by our lower weight to the largest banks, which rallied on economic and regulatory optimism. Overall, our underweight to large caps detracted 118 bps in the quarter and 239 bps year to date. At the same time, our stock selection was weakest among the largest stocks — companies with a market capitalization of $32 billion or greater.
Portfolio Activity
Though we are approaching this market opportunistically, we are willing to be patient and keep our powder dry until fundamentally attractive stocks that fit our 10 Principles of Value Investing™ from a bottom-up perspective are uncovered. During the quarter, we trimmed holdings where the risk-reward profile deteriorated or where we saw opportunities to harvest tax losses, letting our cash position rise modestly to help ensure we’re positioned to take advantage of future market volatility.

Technology. During the quarter, we initiated a new position in Applied Materials, Inc. (AMAT), the largest and most diversified supplier of capital equipment, services, and solutions for semiconductor manufacturing. The company is a major supplier of wafer fabrication equipment (WFE), controlling 21% market share, which was built over decades of organic and inorganic growth. It is the world’s dominant player in deposition, a highly precise, mission-critical step in the fabrication process where a thin film imparts electrical characteristics to the wafer’s surface at the atomic level.
We capitalized on the cyclical downturn in the semiconductor industry to purchase AMAT near our downside target. Our confidence in the company was further strengthened by insider buying, especially a $7mm stock purchase by CEO Gary Dickerson in early April.
In our opinion, Applied Materials will enjoy several tailwinds, including increased demand for advanced packaging and complex manufacturing processes fueled by rising chip architecture complexity. That should boost WFE spending, positioning AMAT as a secular beneficiary.
These tailwinds should lead to a re-rating of the stock as a premier analog semiconductor manufacturer along with Texas Instruments and Analog Devices, which command a multiple well above 25x earnings. At that multiple, AMAT shares could trade in the low $300 range based on mid-cycle EPS, up from its current price of around $170 a share.