At Heartland, our 10 Principles of Value Investing™ simultaneously focus on the quantitative aspects of investing that measure things like financial soundness and valuations in addition to qualitative attributes such as the strength of a company’s management team. That’s because we believe there’s both an art and a science to investing.
Similarly, while the vast majority of the research we conduct is fundamental in nature, we also utilize technical analysis to help confirm or question the conclusions we draw. As objective as we try to be, we are mindful that as human beings our behavioral tendencies can skew our perspectives. Technical analysis—which attempts to gauge investor psychology by observing the price action, trading volume, and historic chart patterns of a security—can tell us how our fundamental research fits with the mindset of the market. For instance, if we think a stock has been unfairly treated and view it as a value opportunity, technical analysis can give us clues whether investors are coming around to our point of view. If that security begins stabilizing and trading in a tight price range after a recent downtrend, that could be a sign that downward momentum is on the wane and sellers may have begun exiting the stock.
An example of this took place at the start of the year, when refining stocks were in a steep slide. See the chart below:
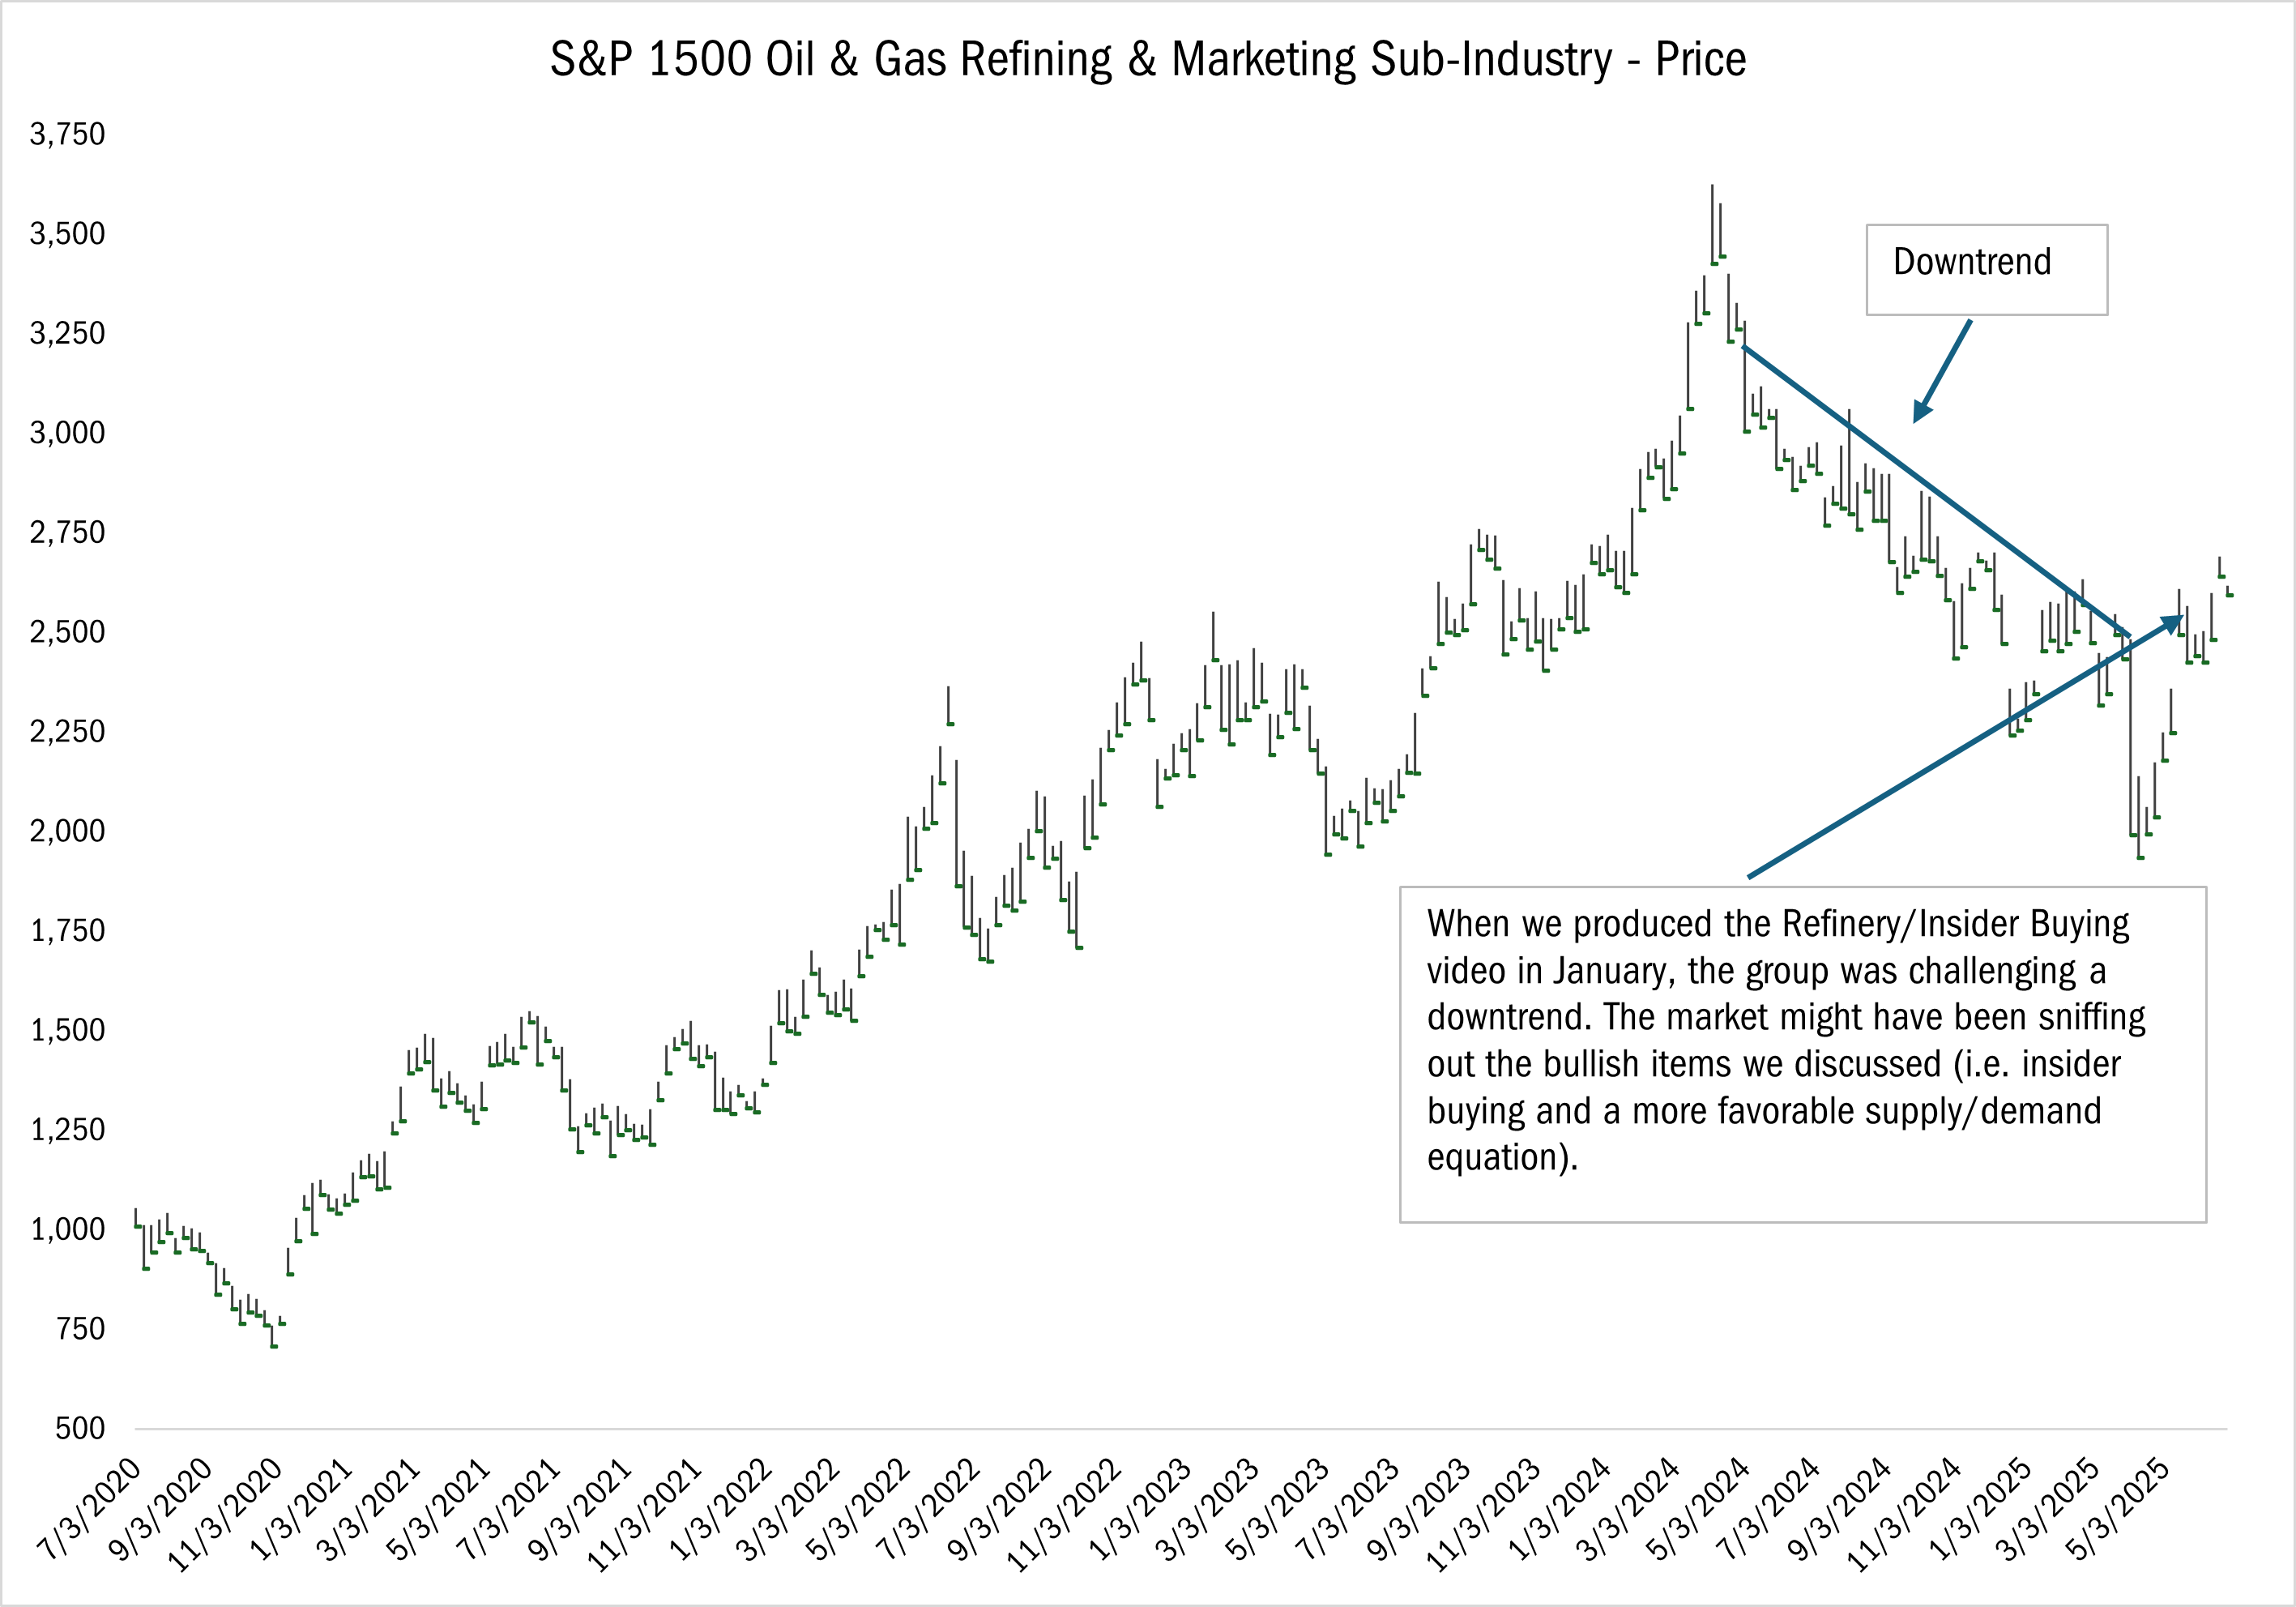
Source: FactSet Research Systems Inc. Monthly data 7/3/2020 to 6/27/2025. The data in this chart represents the S&P 1500 Oil % Gas Refining & Marketing Sub Industry by Price. The S&P Composite 1500® combines three leading indices, the S&P 500®, the S&P MidCap 400®, and the S&P SmallCap 600®, to cover approximately 90% of U.S. market capitalization. It is designed for investors seeking to replicate the performance of the U.S. equity market or benchmark against a representative universe of tradable stocks. It is not possible to invest in an index. Past performance does not guarantee future results.
At the time, fundamental factors such as improved supply-demand dynamics owing to refining closures and insider buying piqued our interest in the group. But to verify the veracity of our viewpoint, we turned to technical analysis for signs that the stock had broken out of its downtrend. Based on the recent improved trading patterns for this group, it appears that investors agree that the fundamentals for this group are likely to improve.
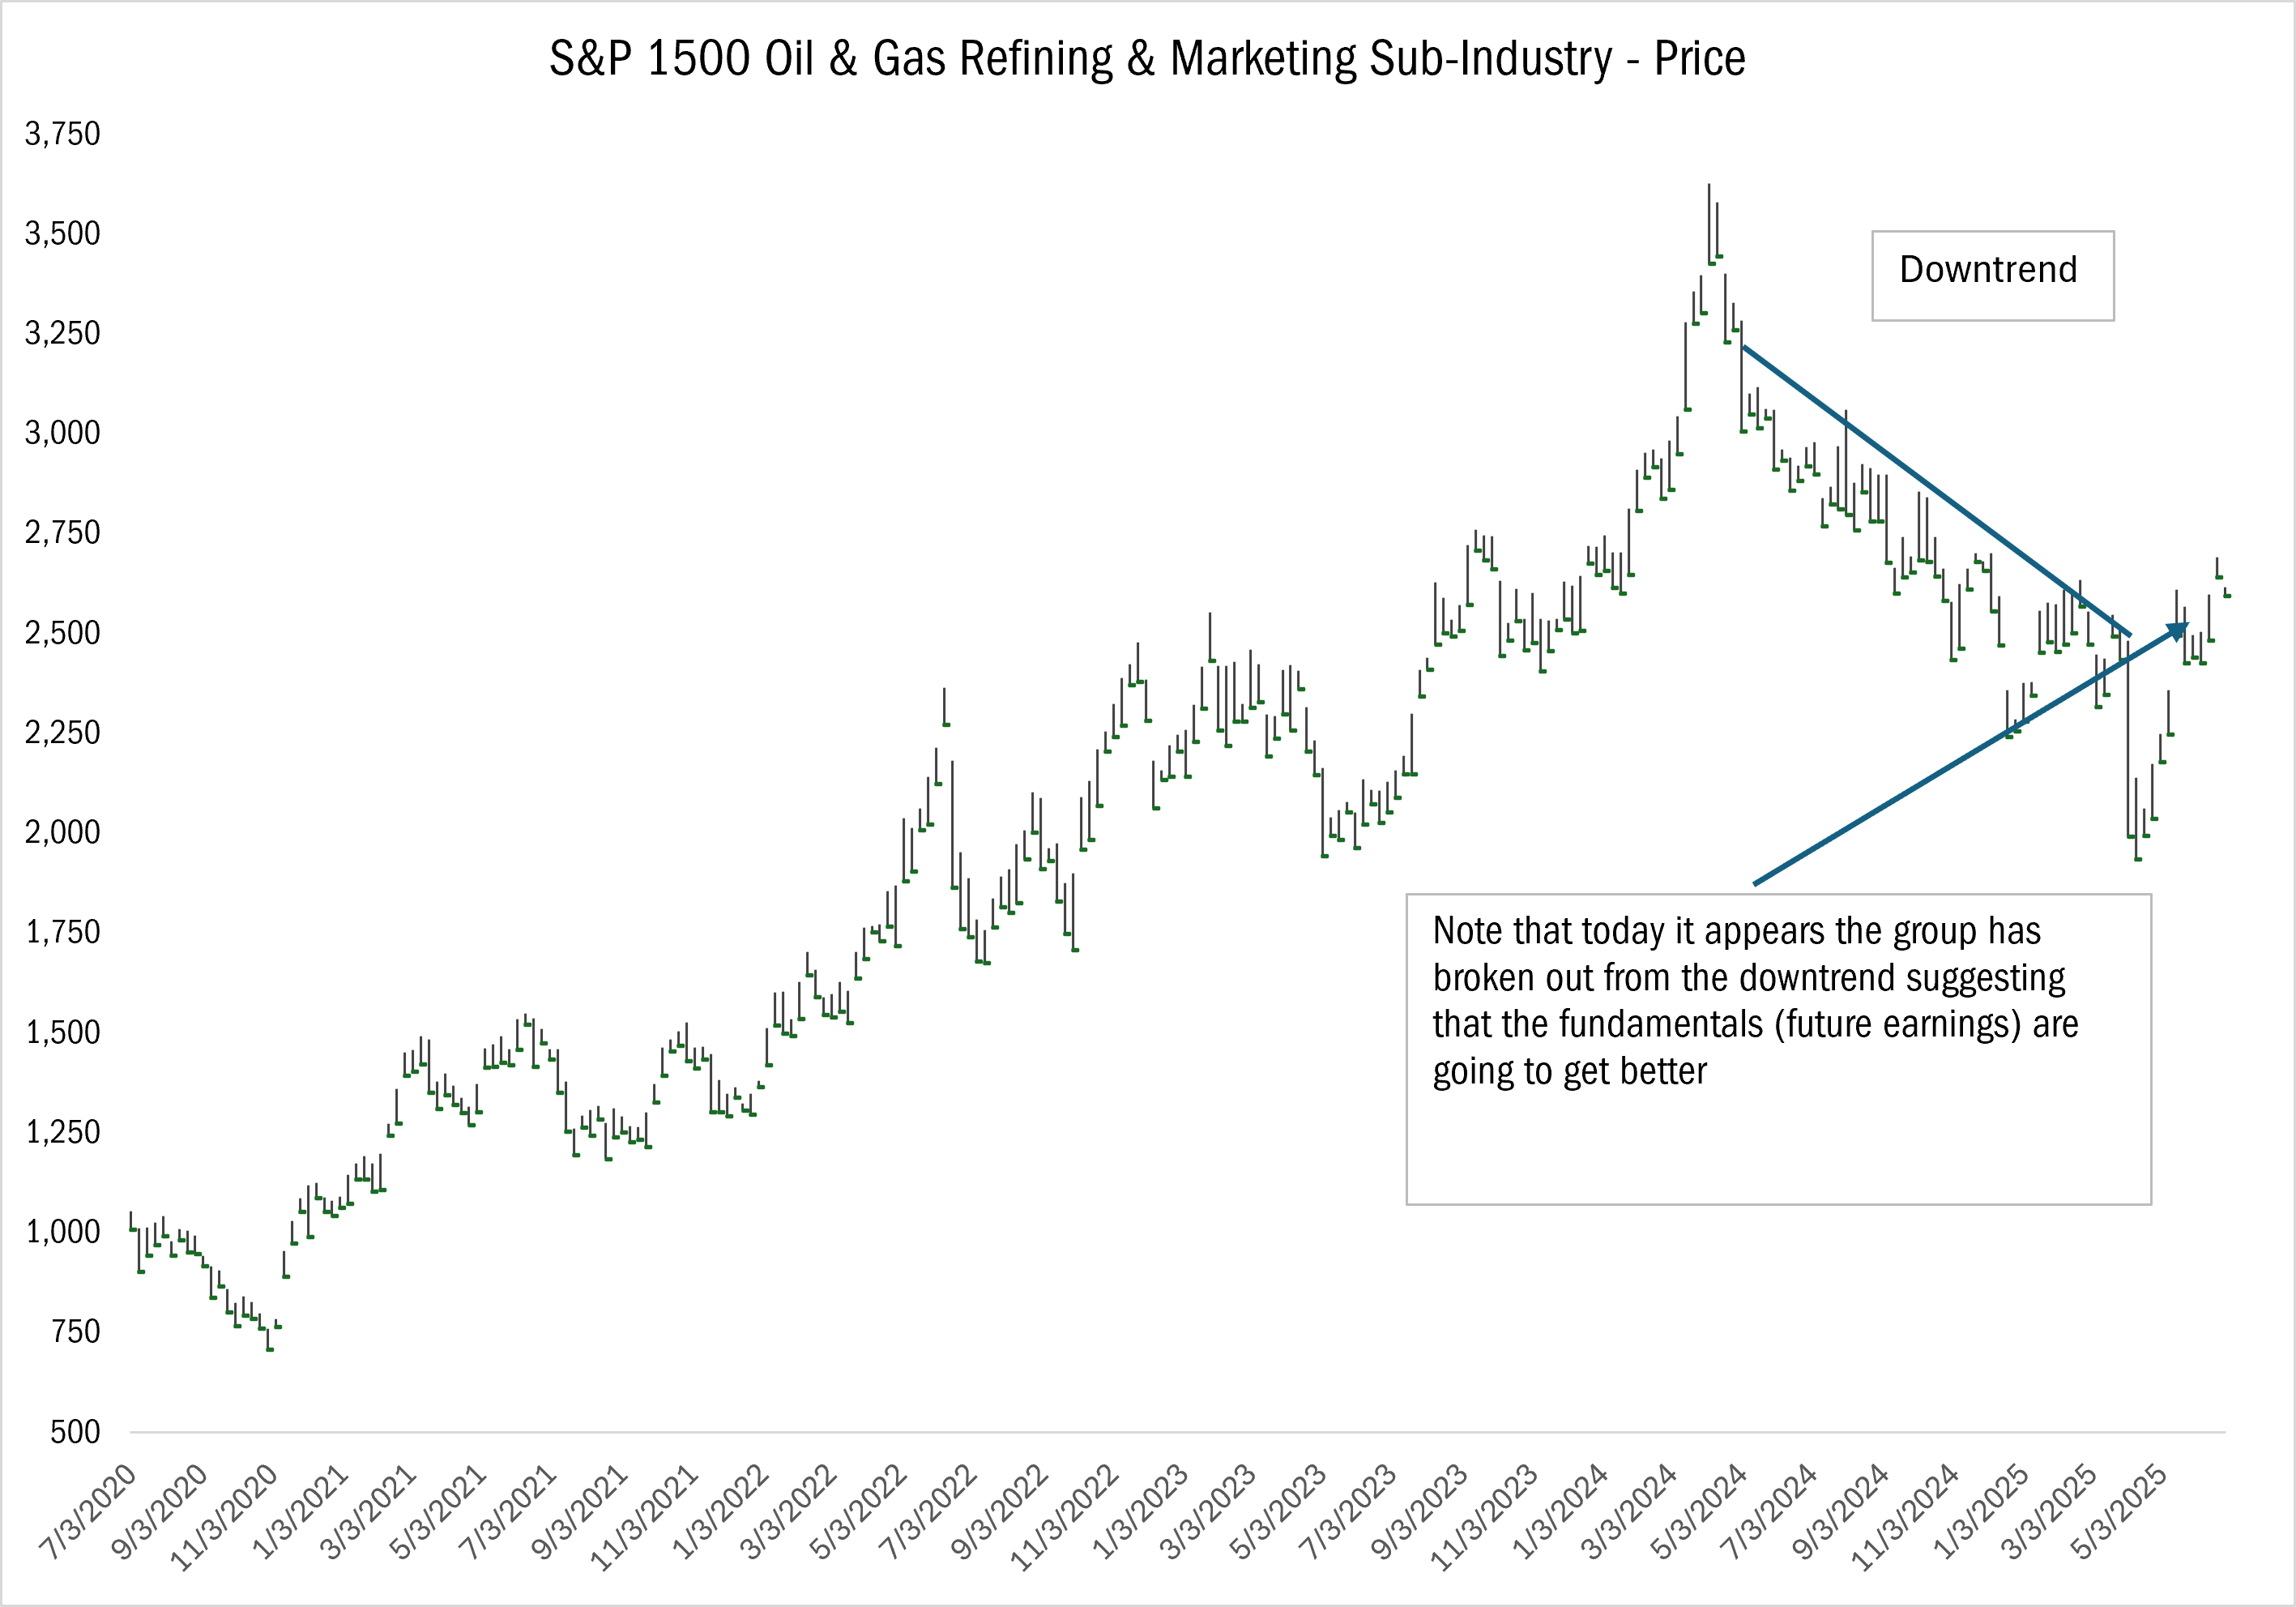
Source: FactSet Research Systems Inc. Monthly data 7/3/2020 to 6/27/2025. The data in this chart represents the S&P 1500 Oil % Gas Refining & Marketing Sub Industry by Price, noting that the downward trend could suggest that future earnings are going to get better. The S&P Composite 1500® combines three leading indices, the S&P 500®, the S&P MidCap 400®, and the S&P SmallCap 600®, to cover approximately 90% of U.S. market capitalization. It is designed for investors seeking to replicate the performance of the U.S. equity market or benchmark against a representative universe of tradable stocks. It is not possible to invest in an index. Past performance does not guarantee future results.
In fact, if you look at the chart patterns for the refining group versus the energy market as a whole, refining stocks have actually been performing better than the broad sector, which is one way that technical analysis can confirm our fundamental research.
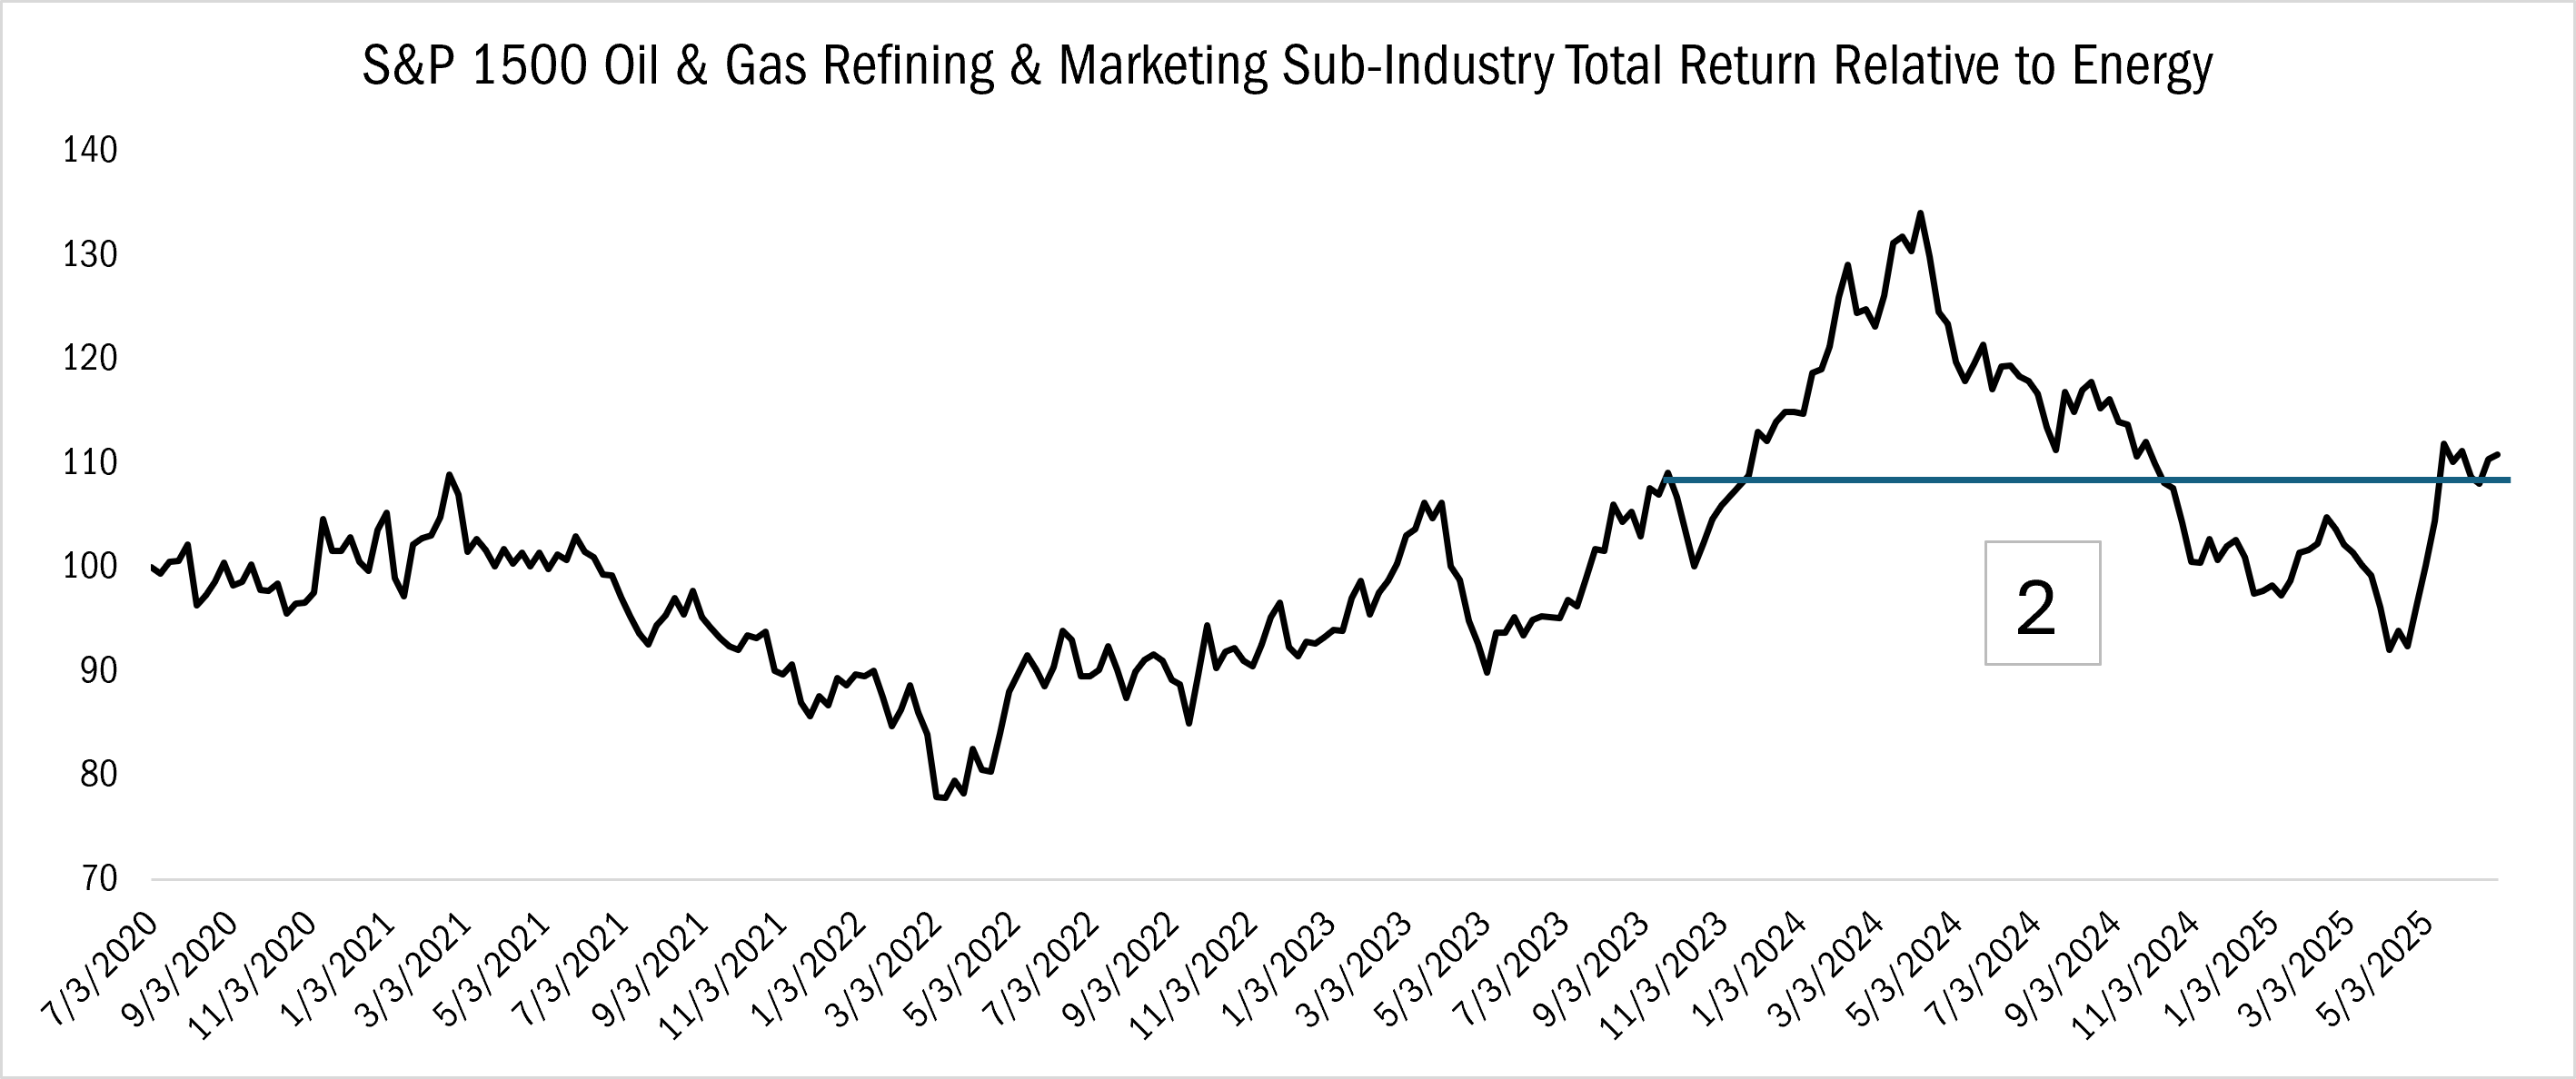
Source: FactSet Research Systems Inc. Monthly data 7/3/2020 to 6/27/2025. The data in this chart represents the S&P 1500 Oil % Gas Refining & Marketing Sub Industry Total Return relative to Energy. The S&P Composite 1500® combines three leading indices, the S&P 500®, the S&P MidCap 400®, and the S&P SmallCap 600®, to cover approximately 90% of U.S. market capitalization. It is designed for investors seeking to replicate the performance of the U.S. equity market or benchmark against a representative universe of tradable stocks. It is not possible to invest in an index. Past performance does not guarantee future results.
This is not to say that we use chart patterns to make all our investment decisions. Our security selection will always be driven by bottoms-up fundamental research that focuses on a company’s earnings dynamics, valuations, balance sheet strength, and business strategy, among other factors. However, there’s never perfect clarity when it comes to this type of research, and if technical analysis helps with visibility, we will utilize that tool to better serve our shareholders.
©2026 Heartland Advisors | 790 N. Water Street, Suite 1200, Milwaukee, WI 53202 | Business Office: 414-347-7777 | Financial Professionals: 888-505-5180 | Individual Investors: 800-432-7856
Past performance does not guarantee future results.
Investing involves risk, including the potential loss of principal.
There is no guarantee that a particular investment strategy will be successful.
Value investments are subject to the risk that their intrinsic value may not be recognized by the broad market.
The statements and opinions expressed in the articles or appearances are those of the presenter. Any discussion of investments and investment strategies represents the presenters' views as of the date created and are subject to change without notice. The opinions expressed are for general information only and are not intended to provide specific advice or recommendations for any individual. Any forecasts may not prove to be true.
Economic predictions are based on estimates and are subject to change.
Heartland Advisors’ 10 Principles of Value Investing™ consist of the following criteria for selecting securities: (1) catalyst for recognition; (2) low price in relation to earnings; (3) low price in relation to cash flow; (4) low price in relation to book value; (5) financial soundness; (6) positive earnings dynamics; (7) sound business strategy; (8) capable management and insider ownership; (9) value of company; and (10) positive technical analysis.
Heartland’s investing glossary provides definitions for several terms used on this page.
ALPS Distributors, Inc., is not affiliated with Heartland Advisors.