At Heartland, we care deeply about the earnings dynamics of the companies we own and evaluate. In fact, it’s one of our 10 Principles of Value Investing™ because history shows that over the long run, profits drive stock prices. However, just as important, if not more, is the price we’re paying for that net income, which is another one of our 10 Principles of Value Investing™.
Why do we care about low price/earnings ratios? How much you pay for the companies you buy has been a key determinant of the prospective returns of those shares. Case in point: On April 28, 1999, the P/E ratio for the S&P 500 large-cap index climbed 7.6 points higher than the multiple for the S&P 600 index of small stocks. That represented an extreme two-standard deviation gap and stood in stark contrast to the historic average disparity of just 0.4 points. Had you invested in the frothy S&P 500 on that day and held it for the next 10 years, you would have lost 2.78% annually. By comparison, had you invested in the relatively cheap S&P 600 at the same time, you would have earned 4.86% a year over the subsequent decade.
We believe this is a particularly illustrative example because the gap between large- and small-stock valuations has once again reached similar extreme levels amid the market’s growing appetite for mega caps benefitting from the AI boom. In mid-August, the P/E ratio for large stocks stood at 22.20, compared with just 14.57 for small caps, representing another 7.6-point differential (see the chart below).
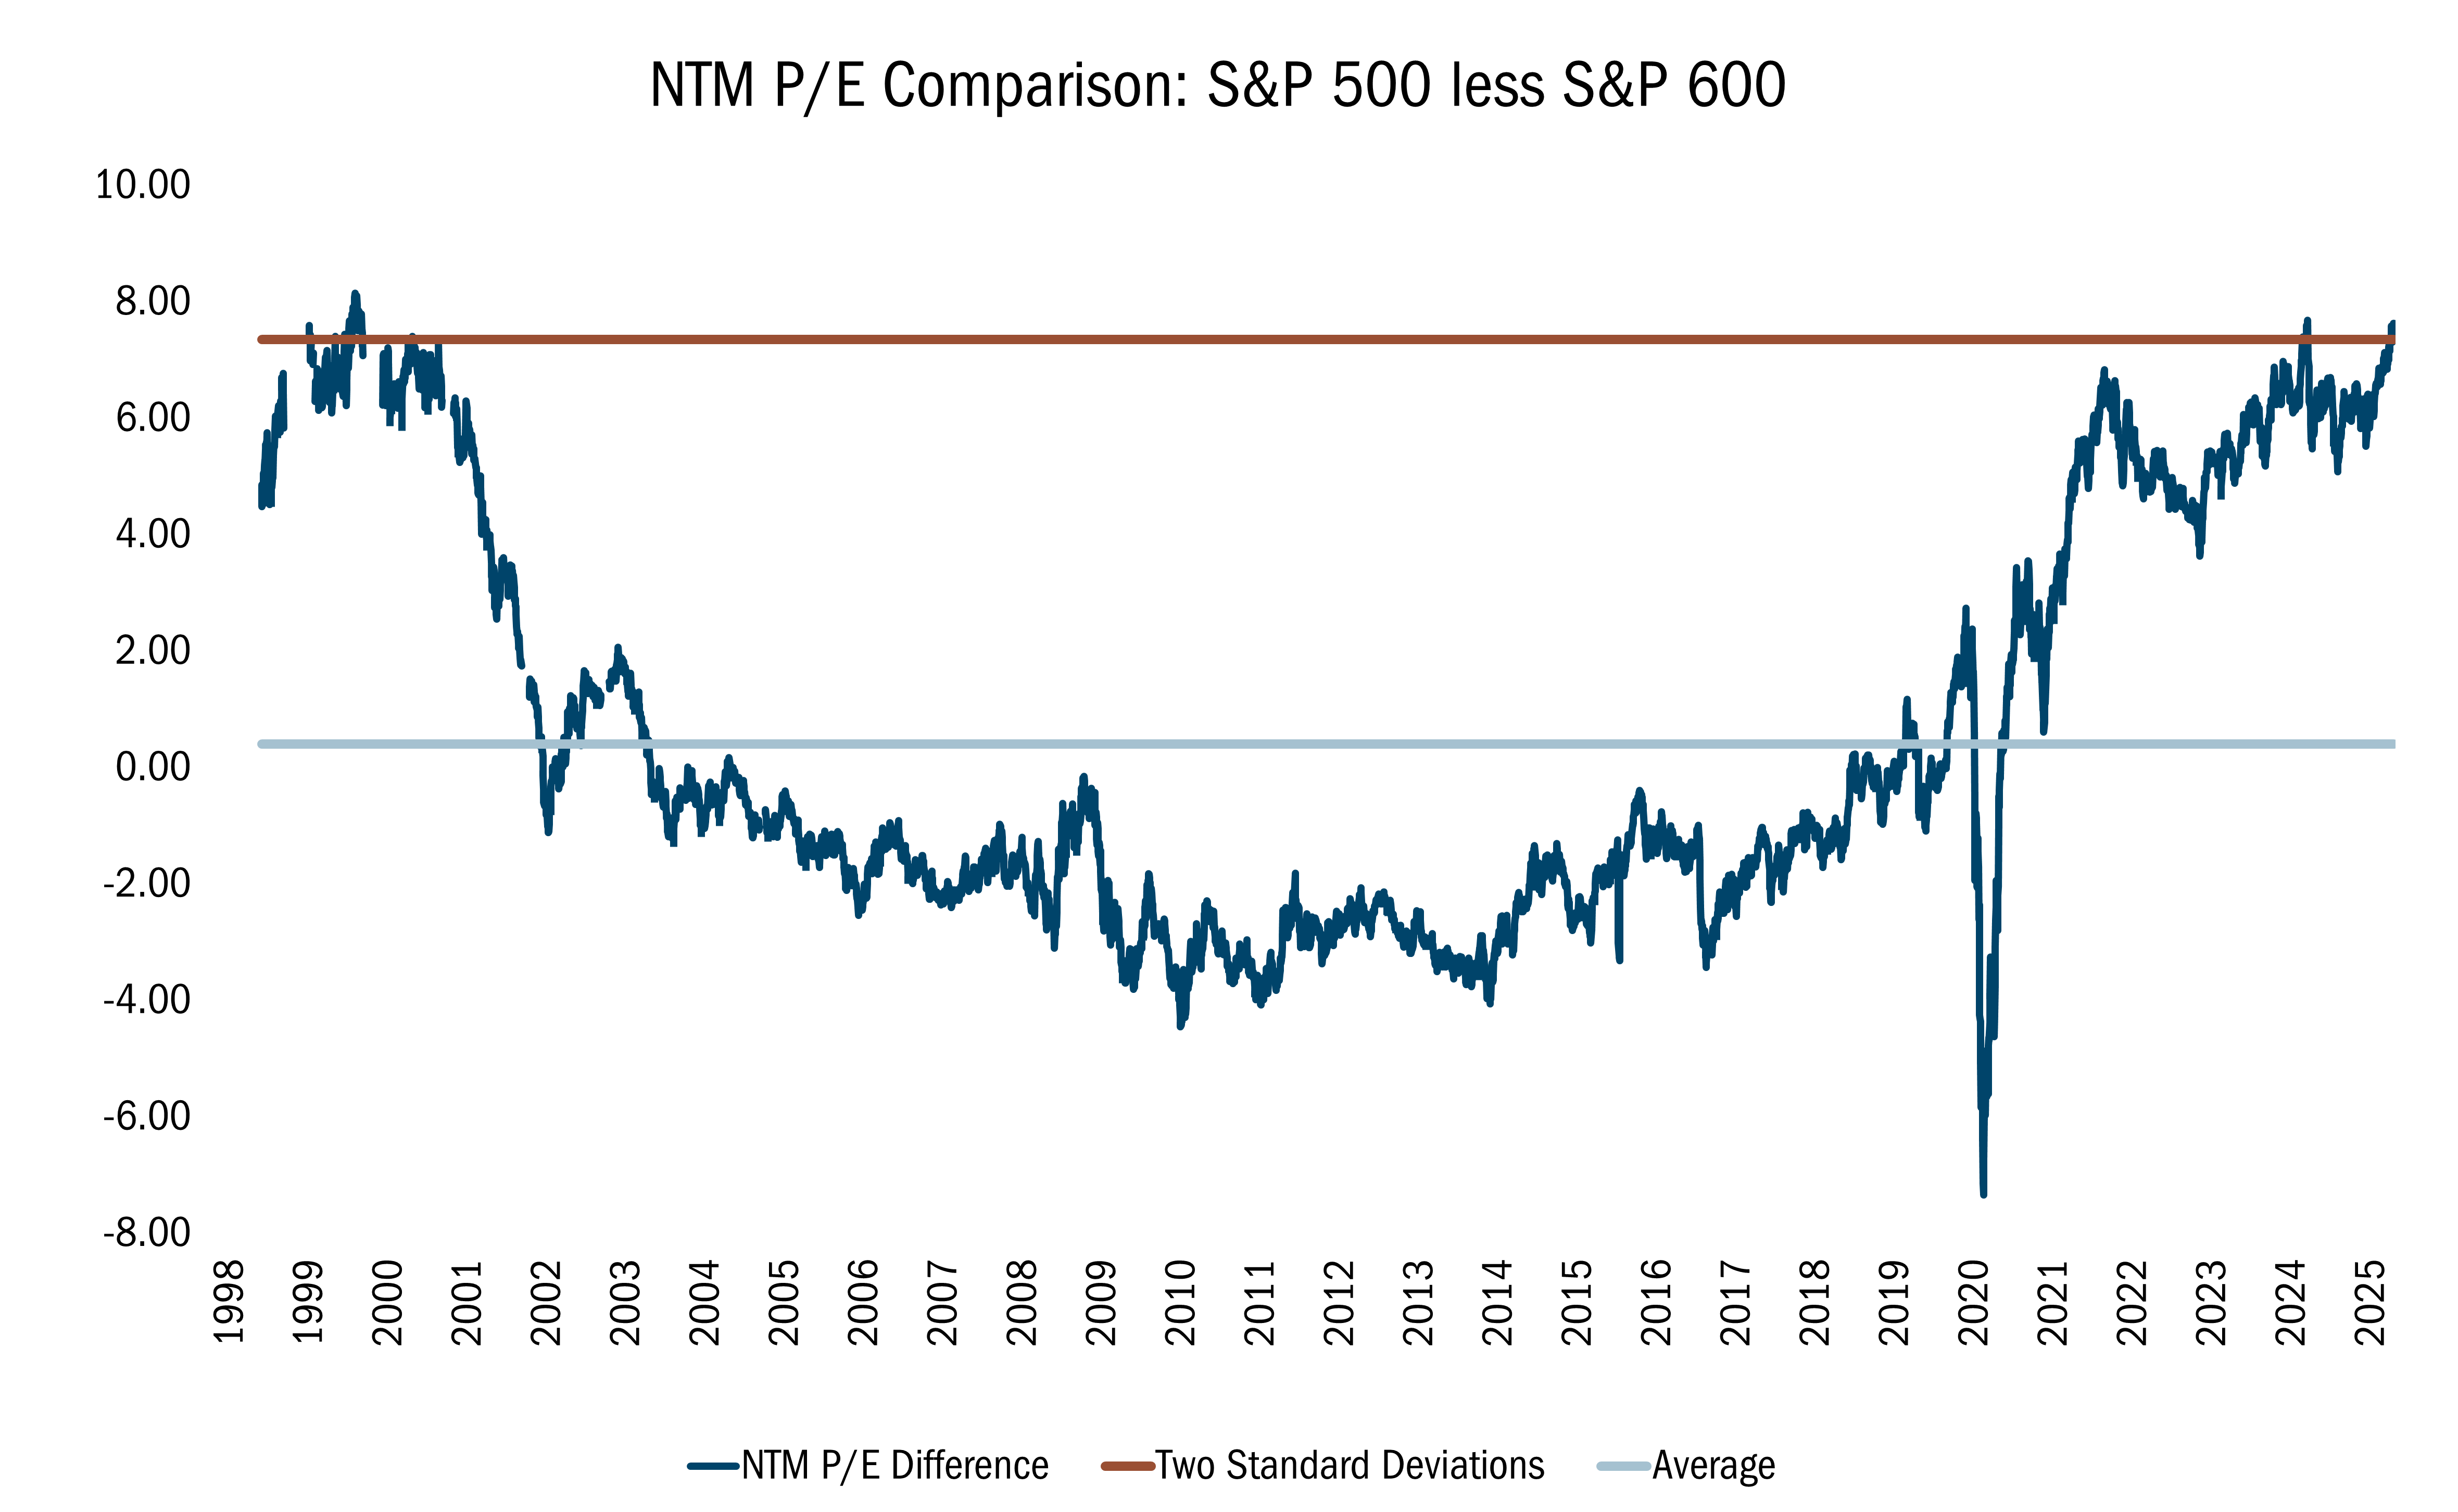
Source: FactSet Research Systems Inc. Daily data 9/22/1998 to 8/11/2025. The data in this chart represents the Price to Earnings comparison over the next year of the S&P 500 and S&P 600. All indices are unmanaged. It is not possible to invest in an index. Past performance does not guarantee future results.
This extreme valuation gap comes at a time when the competition for investment dollars is heating up. Today, you can buy 10-Year U.S. Treasury notes yielding a little more than 4%. In comparison, for stocks, you can take the inverse of the P/E ratio—in other words, divide stock earnings by price. When you do that, the 22.2 multiple for the S&P 500 index turns into a 4.5% “earnings yield,” which is close to the equivalent of what 10-Year Treasuries are paying despite the substantially higher level of risk associated with equities.
However, if you take the inverse of the small-cap P/E ratio of 14.57, you get an earnings yield of nearly 7%, which we believe is quite attractive relative to the essentially risk-free Treasury yield of slightly more than 4%.
This is not to say that valuations are the sole driver of our decision-making. Low P/E ratios are just one of our 10 Principles of Value Investing™ that also includes other measures of valuations, including low price to cash flow and low price to book value. Our 10 Principles of Value Investing™ are also designed to lead us to financially sound companies with low debt, capable management teams and compelling business strategies. That said, the price/earnings ratio is a valuable tool we consistently use to understand the risk/reward dynamics of investments we’re considering.
©2026 Heartland Advisors | 790 N. Water Street, Suite 1200, Milwaukee, WI 53202 | Business Office: 414-347-7777 | Financial Professionals: 888-505-5180 | Individual Investors: 800-432-7856
Past performance does not guarantee future results.
Investing involves risk, including the potential loss of principal.
There is no guarantee that a particular investment strategy will be successful.
Value investments are subject to the risk that their intrinsic value may not be recognized by the broad market.
The statements and opinions expressed in the articles or appearances are those of the presenter. Any discussion of investments and investment strategies represents the presenters' views as of the date created and are subject to change without notice. The opinions expressed are for general information only and are not intended to provide specific advice or recommendations for any individual. Any forecasts may not prove to be true.
Economic predictions are based on estimates and are subject to change.
Heartland Advisors’ 10 Principles of Value Investing™ consist of the following criteria for selecting securities: (1) catalyst for recognition; (2) low price in relation to earnings; (3) low price in relation to cash flow; (4) low price in relation to book value; (5) financial soundness; (6) positive earnings dynamics; (7) sound business strategy; (8) capable management and insider ownership; (9) value of company; and (10) positive technical analysis.
Heartland’s investing glossary provides definitions for several terms used on this page.