Heartland Advisors

Heartland Opportunistic Value Equity Strategy 1Q24 Portfolio Manager Commentary

Executive Summary

  • Stocks continued to surge in the first quarter, though this was a more nuanced rally than at the end of last year.   
  • Given how well equities have performed over the past six months, investors’ margin of safety has diminished meaningfully. 
  • We believe this market calls for a balanced approach, focused on well-managed, financially strong businesses that can flourish whether the economy is set to slow or re-accelerate.

First Quarter Market Discussion

After rallying at the end of last year, the equity market continued to climb in the first quarter, as many investors stopped worrying about potential economic weakness and shifted their focus to how a pivot in Federal Reserve monetary policy could be a meaningful tailwind to asset values. The Russell 3000® Index gained 10.02% in the first three months of the year and is up 29.29% over the past year.

While euphoria surrounding artificial intelligence (AI) proliferation and publicly funded infrastructure spending continued to push stocks higher, helping large caps in particular, this was a more nuanced rally than we witnessed at the end of last year. High beta stocks, with greater market sensitivity, underperformed in January as the market appeared to be gravitating toward higher quality, larger-cap names. Within the value universe, small value trailed large by 7% through mid-March as measured by the performance of the Russell 2000® Value Index relative to the Russell 1000® Value Index.

We believe this sets up an environment where a tempered and balanced approach makes sense. Though the market appears to be ignoring the possibility of an economic recession and is instead focusing on an ‘early cycle’ recovery, we don’t think this rosy scenario is a sure bet, although it remains one possible outcome on a spectrum of scenarios. 

Indeed, while the economy continues to produce jobs at a decent clip, there are cracks developing in the labor market. Historically, there’s been an inverse correlation between jobless claims and the National Federation of Independent Business (NFIB) Hiring Index. Lately, small business hiring intent has been headed in the wrong direction, perhaps a consequence of small business optimism falling below levels preceding past recessions of 2020, 2001, and 1990.

Consumer Confidence Index v. Real GDP Growth

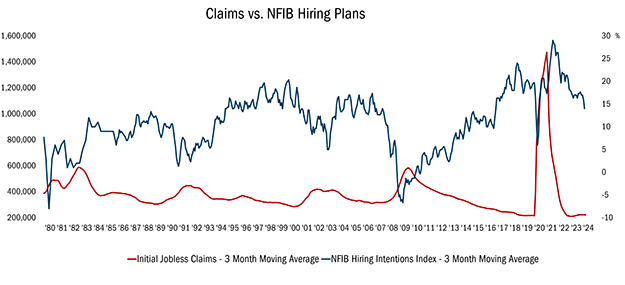
Source: FactSet Research Systems Inc., monthly data from 1/31/1980 to 3/31/2024. This chart represents the small business hiring demand is waning, which historically is inversely correlated with raising joblessness. National Federation of Independence Businesses (NFIB). All indices are unmanaged. It is not possible to invest directly in an index. Past performance does not guarantee future results.

That’s not to say we are bearish. However, we will not take our eyes off potential downside risks in hopes of capturing every ounce of a perceived early cycle upturn. At the very least, it’s important to recognize that the margin of safety has diminished given recent performance.

Attribution Analysis

Our Strategy gained 6.58% in the first quarter, trailing the Russell 3000® Value Index, which posted returns of 8.62%. Stock selection detracted from the Strategy’s performance in the quarter, particularly in the Industrials, Technology, and Health Care sectors.

There was a ‘big’ reason for that underperformance. Our Strategy has been meaningfully underweight stocks in the top decile of market capitalization. Meanwhile, the first quarter rally was led by large caps, thanks in part to the excitement surrounding AI. Better earnings revisions among companies in the Russell 1000® Index versus those in the Russell 2000® Index also helped.

Over the past 12 months, however, our Strategy outperformed the benchmark, gaining 19.19% versus 20.18% for the Index, thanks almost entirely to stock selection. 

Portfolio Activity

We construct our portfolio from a bottom-up perspective, including our allocations to small-, mid-, and large-caps. Our overall exposure to the latter rose 3 percentage points in the quarter to 33%, because of the outperformance of our large-cap holdings and because we added a compelling new holding, The Hershey Company, to the portfolio. Similarly, our mid-cap weighting fell by 3 percentage points to 31%, in part because we trimmed or exited several positions, including CBOE Global Markets Inc. and Howmet Aerospace Inc., for valuation reasons. 

You can read more about these and other holdings here:

Consumer Staples. When shares of the leading chocolate confectionary company The Hershey Company (HSY) sank 32% from their 2023 peak—owing, in part, to volume headwinds and margin pressures from rising cocoa prices—it created an opening to build a new position. 

The company, known for such popular brands as Hershey’s, Reese’s, Cadbury, and Jolly Rancher, has historically traded at a premium to its consumer staples peers; however, in an environment where consumer finances are stressed and input costs are climbing, that premium has disappeared. 

We believe Hershey simply needs to demonstrate to investors that these headwinds are temporary in nature, while once again showcasing its ability to balance superior profitability with modest growth and stable market share. Cocoa prices, a key input for HSY, experienced a nearly unprecedented price spike on supply disruptions in West Africa (where the majority of global supply originates). While we cannot predict when cocoa prices deflate, we are confident HSY and its largest competitors will be slow to reverse price increases required to recoup input cost inflation. Encouragingly, after being hampered by supply chain constraints in the post COVID-19 environment, HSY has a greater product innovation slate and more production capacity to grow in the coming years. 

Meanwhile, the stock is trading near historic lows relative to other blue chips consumer staples, the consumer staples sector as a whole, and the broad market.

Healthcare. Becton, Dickinson and Company (BDX) disappointed investors with its 2024 guidance, because earnings growth in the first half of 2024 will be hindered by inventory reduction efforts. Shares of the global medical supplies, laboratory equipment, and diagnostic products manufacturer are down more than 15% from their July 2023 peak. 

We believe BDX, whose business has historically been resilient and economically defensive thanks to a largely consumable product portfolio, should drive revenue and cash flow growth acceleration via management’s strategy to simplify the business. The company is divesting its Diabetes Care business, while its Urology & Critical Care group is discontinuing approximately 2,000 products and exiting non-strategic segments. This is part of a cost-reduction initiative aimed at driving $300 million in savings this year, which should boost margins.

Meanwhile, the stock is cheap on a price/earnings basis. BDX has historically enjoyed a 10%-30% premium to the S&P 500; today, it’s trading at a 15% discount.

Outlook

While we understand that the consensus view of a ‘soft landing’ is quite possible, it’s not the only path the economy could take. That’s why we are committed to approaching this market with patience and discipline. From our vantage point, we are not seeing as many fat pitches to swing at, and we don’t believe it makes sense to swing outside of our strike zone. This view is rooted in our 10 Principles of Value Investing™, which requires us to look for well-managed, financially strong businesses that can grow cash flow and intrinsic value over time.

Thank you for your continued trust and confidence.

Please wait while we gather your results.

Portfolio Management Team

Heartland Advisors Value Investing Portfolio Manager Troy McGlone

Troy McGlone

Vice President and Portfolio Manager

Heartland Advisors Value Investing Portfolio Manager Colin McWey

Colin McWey

Vice President and Portfolio Manager

Composite Returns*

3/31/2024

Scroll over to view complete data

Since Inception (%)10-Year (%)5-Year (%)3-Year (%)1-Year (%)YTD (%)QTD (%)
Opportunistic Value Equity Composite (Net of Advisory Fees)**10.088.5610.1110.4220.836.956.95
Opportunistic Value Equity Composite (Net of Bundled Fees)8.066.638.358.8419.196.586.58
Russell 3000® Value7.658.8610.187.7420.188.628.62

Source: FactSet Research Systems Inc., Russell Investment Group, and Heartland Advisors, Inc.
*Yearly and quarterly returns are not annualized. The Strategy's inception date is 9/30/1999. 
**Shown as supplemental information. 

The US Dollar is the currency used to express performance. Returns are presented net of advisory fees and net of bundled fees and include the reinvestment of all income. The returns net of bundled fees were calculated by subtracting the highest applicable sponsor portion of the separately managed wrap account fee from the net of advisor fees return.

Opportunistic Value Equity Strategy Quick Links

Factsheet


Download PDF

Commentary


View Commentary

Attribution & Contribution Reports

Sign In

Holdings


Sign In


Email Sign Up


©2024 Heartland Advisors | 790 N. Water Street, Suite 1200, Milwaukee, WI 53202 | Business Office: 414-347-7777 | Financial Professionals: 888-505-5180 | Individual Investors: 800-432-7856

Past performance does not guarantee future results.

The Opportunistic Value Equity Strategy seeks to capture long-term capital appreciation by investing in companies with market capitalizations greater than $500 million. The Strategy’s flexible pursuit of value positions it as a core holding for investors.
 

In addition to stocks of large companies, the Opportunistic Value Equity Strategy invests in stocks of small- and mid-cap companies that are generally less liquid than large companies. The performance of these holdings generally will increase the volatility of the strategy’s returns.

Value investments are subject to the risk that their intrinsic value may not be recognized by the broad market.

Heartland Advisors, Inc. (the "Firm") claims compliance with the Global Investment Performance Standards (GIPS®). The Firm is a wholly owned subsidiary of Heartland Holdings, Inc., and is registered with the Securities and Exchange Commission. For a complete list and description of Heartland Advisors composites and/or a presentation that adheres to the GIPS® standards, contact the Institutional Sales Team at Heartland Advisors, Inc. at the address listed below.

As of 3/31/2024 Becton, Dickinson & Company (BDX) and The Hershey Company (HSY) represented 3.15% and 2.66% of the Opportunistic Value Equity Composite’s net assets, respectively.

The future performance of any specific investment or strategy (including the investments discussed above) should not be assumed to be profitable or equal to past results. The performance of the holdings discussed above may have been the result of unique market circumstances that are no longer relevant. The holdings identified above do not represent all of the securities purchased, sold or recommended for the Advisor’s clients.

Statements regarding securities are not recommendations to buy or sell. 

Portfolio holdings are subject to change. Current and future portfolio holdings are subject to risk.

GIPS® is a registered trademark of CFA Institute. CFA Institute does not endorse or promote this organization, nor does it warrant the accuracy or quality of the content contained herein.

Separately managed accounts and related investment advisory services are provided by Heartland Advisors, Inc., a federally registered investment advisor. ALPS Distributors, Inc., is not affiliated with Heartland Advisors, Inc.

The statements and opinions expressed in this article are those of the presenter(s). Any discussion of investments and investment strategies represents the presenters’ views as of the date created and are subject to change without notice. The opinions expressed are for general information only and are not intended to provide specific advice or recommendations for any individual. The specific securities discussed, which are intended to illustrate the advisor’s investment style, do not represent all of the securities purchased, sold, or recommended by the advisor for client accounts, and the reader should not assume that an investment in these securities was or would be profitable in the future. Certain security valuations and forward estimates are based on Heartland Advisors’ calculations. Any forecasts may not prove to be true. 

Economic predictions are based on estimates and are subject to change.

There is no guarantee that a particular investment strategy will be successful.

Sector and Industry classifications are sourced from GICS®.The Global Industry Classification Standard (GICS®) is the exclusive intellectual property of MSCI Inc. (MSCI) and S&P Global Market Intelligence (“S&P”).  Neither MSCI, S&P, their affiliates, nor any of their third party providers (“GICS Parties”) makes any representations or warranties, express or implied, with respect to GICS or the results to be obtained by the use thereof, and expressly disclaim all warranties, including warranties of accuracy, completeness, merchantability and fitness for a particular purpose.  The GICS Parties shall not have any liability for any direct, indirect, special, punitive, consequential or any other damages (including lost profits) even if notified of such damages.

Heartland Advisors defines market cap ranges by the following indices: micro-cap by the Russell Microcap®, small-cap by the Russell 2000®, mid-cap by the Russell Midcap®, large-cap by the Russell Top 200®.

Because of ongoing market volatility, performance may be subject to substantial short-term changes.

Dividends are not guaranteed and a company’s future ability to pay dividends may be limited. A company currently paying dividends may cease paying dividends at any time.

In certain cases, dividends and earnings are reinvested.

There is no assurance that dividend-paying stocks will mitigate volatility.

CFA® is a registered trademark owned by the CFA Institute.

Russell Investment Group is the source and owner of the trademarks, service marks and copyrights related to the Russell Indices. Russell® is a trademark of the Frank Russell Investment Group.

Data sourced from FactSet: Copyright 2024 FactSet Research Systems Inc., FactSet Fundamentals. All rights reserved.

Heartland’s investing glossary provides definitions for several terms used on this page.

Artificial intelligence (AI) is intelligence—perceiving, synthesizing, and inferring information—demonstrated by computers, as opposed to intelligence displayed by humans or by other animals. Beta is a measure of the sensitivity of a portfolio's rates of return against those of the market. A beta less than 1 indicates volatility less than that of the market. Bottom-up is an investment approach that de-emphasizes the significance of economic and market cycles. This approach focuses on the analysis of individual stocks and the investor focuses his or her attention on a specific company rather than on the industry in which that company operates or on the economy as a whole. Earnings Before Interest, Taxes, Depreciation and Amortization (EBITDA) measures a company’s financial performance. It is used to analyze and compare profitability between companies and industries because it eliminates the effects of financing and accounting decisions. Enterprise Value/Earnings Before Interest, Taxes, Depreciation, and Amortization (EV/EBITDA) Ratio is a financial indicator used to determine the value of a company and is calculated by dividing the entire economic value of the company (enterprise value) by its earnings before interest, taxes, depreciation, and amortization (EBITDA). Free Cash Flow is the amount of cash a company has after expenses, debt service, capital expenditures, and dividends. The higher the free cash flow, the stronger the company’s balance sheet. Intrinsic Value is the actual value of a company, or an asset based on an underlying perception of its true value including all aspects of the business, in terms of both tangible and intangible factors. This value may or may not be the same as the current market value. Margin of Safety is a principle of investing in which an investor only purchases securities when the market price is significantly below its intrinsic value. NFIB Small Business Optimism Index is a small business optimism index compiled from a survey that is conducted each month by the National Federation of Independent Business (NFIB) of its members. The index is a composite of ten seasonally adjusted components based on questions on the following: plans to increase employment, plans to make capital outlays, plans to increase inventories, expect economy to improve, expect real sales higher, current inventory, current job opening, expected credit conditions, now a good time to expand, and earnings trend. Price/Earnings Ratio of a stock is calculated by dividing the current price of the stock by its trailing or its forward 12 months’ earnings per share. Russell Investment Group is the source and owner of the trademarks, service marks and copyrights related to the Russell Indices. Russell® is a trademark of the Russell Investment Group. Russell 1000® Index measures the performance of the large-cap segment of the U.S. equity universe. It is a subset of the Russell 3000® Index and includes approximately 1000 of the largest securities based on a combination of their market cap and current index membership. The Russell 1000® represents approximately 92% of the U.S. market.  Russell 1000® Value Index measures the performance of those Russell 1000® companies with lower price/book ratios and lower forecasted growth characteristics. All indices are unmanaged. It is not possible to invest directly in an index. Russell 2000® Index includes the 2000 firms from the Russell 3000® Index with the smallest market capitalizations. All indices are unmanaged. It is not possible to invest directly in an index.  Russell 2000® Value Index measures the performance of those Russell 2000® companies with lower price/book ratios and lower forecasted growth characteristics. All indices are unmanaged. It is not possible to invest directly in an index. Russell 3000® Index is a market capitalization weighted equity index maintained by the Russell Investment Group that seeks to be a benchmark of the entire U.S. stock market and encompasses the 3,000 largest U.S.-traded stocks, in which the underlying companies are all incorporated in the U.S. All indices are unmanaged. It is not possible to invest directly in an index. Russell 3000® Value Index measures the performance of those Russell 3000® Index companies with lower price/book ratios and lower forecasted growth characteristics. S&P 500 Index is an index of 500 U.S. stocks chosen for market size, liquidity and industry group representation and is a widely used U.S. equity benchmark. All indices are unmanaged. It is not possible to invest directly in an index. Volatility is a statistical measure of the dispersion of returns for a given security or market index which can either be measured by using the standard deviation or variance between returns from that same security or market index. Commonly, the higher the volatility, the riskier the security. 10 Principles of Value Investing™ consist of the following criteria for selecting securities: (1) catalyst for recognition; (2) low price in relation to earnings; (3) low price in relation to cash flow; (4) low price in relation to book value; (5) financial soundness; (6) positive earnings dynamics; (7) sound business strategy; (8) capable management and insider ownership; (9) value of company; and (10) positive technical analysis.

top