Fourth Quarter Market Discussion
The ‘soft landing’ narrative that began to coalesce earlier in the year gained momentum in the fourth quarter, as fixed income investors joined the fray and embraced the notion that a Goldilocks economic scenario may be at hand. With inflation fears moderating, yields on 10-Year Treasuries fell from close to 5% in late October to approximately 3.9% at the end of the quarter while high yield spreads tightened significantly.
This resulted in another round of risk-taking in the markets, which sent the Russell Midcap® Index surging almost 20% since Oct. 27 and over 12% since the start of the quarter.
While it’s impossible to know with absolute certainty whether the soft-landing narrative will come to fruition, we do know that the impact of monetary policy tends to lag. We are also aware of risks related to discounting the possibility of surprises in the coming months that could complicate this script.
For instance, the high yield market is priced as if there are no credit risks to worry about. Yet there are some potential canaries in the coalmine hinting at a potential turn in the cycle. Credit card delinquency and charge-off rates are now above their pre-pandemic levels, indicating that households have depleted their excess stimulus savings (see chart below).
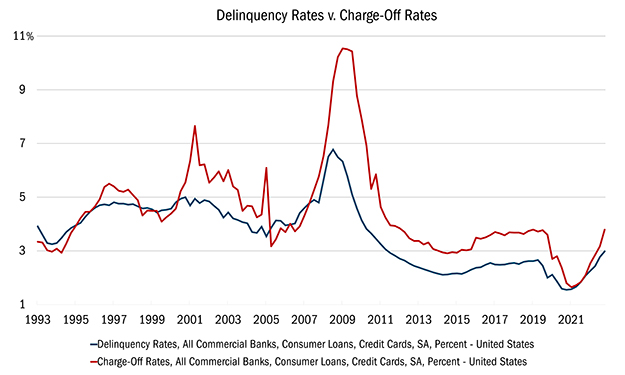
Source: FactSet Research Systems Inc., Quarterly data from 12/31/1993 to 09/29/2023. This chart represents Delinquency Rates compared to Charge-Off Rates in the United States. The delinquency rate is the amount of debt that is past due. Charge-off is a debt deemed uncollectible by the reporting firm. It is written off and removed from the firm's balance sheet. All indices are unmanaged. It is not possible to invest directly in an index. Past performance does not guarantee future results.
Add to this the fact that small business hiring plans have sunk to where they stood in February 2021, amid the global pandemic, and this would seem to signal the possibility of rising unemployment and challenges ahead for consumers.
We believe this is the type of market where investors can’t fixate on what others are doing, to borrow a phrase from Warren Buffett. Instead, they should get back to investing basics, including fundamental research and price awareness. We set multiple price targets for every stock we own (or consider owning) to reflect both good and bad scenarios to prevent us from blindly chasing (or hanging onto) stocks. This enables us to stay true to our 10 Principles of Value Investing™, which demand paying low prices relative to earnings, cash flow, and intrinsic value to help create a margin of safety.
In addition to those core Principles, we believe identifying companies that are taking self-help measures to improve their efficiency, profitability, and competitive advantage, regardless of economic conditions, will provide investors with the best chances for success.
Attribution Analysis
The Mid Cap Value portfolio was up more than 7.5% in the fourth quarter, trailing the Russell Midcap® Value Index, which returned 12.1%. Part of that underperformance was driven by names we don’t own, thanks to the big bounce that speculative and highly leveraged stocks have enjoyed since late October.
Stock selection was also the chief reason why the portfolio outperformed the Russell Midcap® Value Index for the full year, posting returns of approximately 13.8% in 2023 versus 12.7% gains for the benchmark.
Portfolio Activity
While the market’s attention seems to have shifted away from mid value to mid growth in the fourth quarter, we have built our portfolio for the long term by focusing on bottom-up stock selection. We overlay a two-bucket approach on our 10 Principles by seeking to own both high-quality companies trading at decent bargains (“quality-value”) and deeply discounted companies that have produced poor economic returns over time (“deep-value”).
Just as growth and value tend to take turns outperforming, these two styles have also alternated market leadership. If we were to choose one style while ignoring the other in the mid-cap space, we would be introducing a top-down bet on the portfolio, which we want to avoid. We remain confident that effective stock selection in both of these buckets is the best approach in our space.
Below are several examples of quality-value businesses we own that are trading at deep-value-like valuations. Most of the time, the market appropriately rewards high return businesses with premium valuations, but the following companies trade at low valuations because there are fundamental questions about the industry or because there is a company-specific overhang.
 Financials. A big beneficiary of the soft-landing narrative has been Financials, especially highly levered, low-quality companies. While we are underweight the sector, Northern Trust (NTRS), is an example of a quality-value financial with less credit risk exposure than its peers.
NTRS operates two independent financial services businesses. Its Asset Servicing (AS) segment provides a full range of back-office services including custody, fund administration, and investment operations outsourcing to institutional investors globally. Its Wealth Management (WM) segment provides wealth advisory services to high-net-worth individuals and families, business owners, and privately held businesses. Through these operations, Northern Trust generates more than 70% of its revenue from fees, far more than a traditional bank.
The past two years, however, have been challenging for the business model. First, the AS segment is a labor-intensive operation, and the combination of wage inflation and downward pressure on asset values in 2022 caused outsized margin pressure. At the same time, the interest rate Northern Trust must pay for client deposits is closely tied to the Federal Funds rate. Rising short-term rates since 2022 led to deposits moving into alternative options including money market funds and Treasury bills. As a result, Northern Trust’s balance sheet has shrunk by around 15% since its peak in 2022, which in turn drove net interest income down throughout 2023.
We believe net interest income headwinds are moderating as the Federal Reserve’s monetary policy stance has turned neutral to accommodative. Meanwhile, Northern Trust’s modest credit risk allows for more clarity of normalized earnings power relative to a traditional bank. NTRS trades at a price/earnings ratio of 14.9, based on next 12 month profits. That’s below its 20-year median multiple of more than 16, even after consensus earnings forecasts have fallen around 30% from their 2022 peak, making NTRS an attractive long-term opportunity.
 Healthcare. We have mentioned Centene Corporation (CNC) earlier in the year as an example of a company utilizing self-help strategies to move beyond past missteps.
The giant managed health insurance provider—which provides coverage to 25 million Americans, including 14 million Medicaid enrollees in 29 states—underperformed for much of the year. CNC faces reimbursement headwinds including a reduction in its 2024 Medicare Advantage premiums and higher healthcare utilization from the return of elective procedures.
But the stock has been rebounding since September and is up 7.7% for the quarter. In the past, CNC’s operational execution lacked the consistency of other large, premier managed care companies in the U.S. However, the company upgraded its entire executive leadership team in recent years with industry veterans that have a track record of success.
CNC trades at just 11 times 2024 earnings, despite enjoying a 12-15% EPS growth rate. That pace will likely take a breather this year, thanks to Medicare reimbursement headwinds. But it should resume after 2024, with encouraging margin expansion and earnings growth prospects for years to come.
 Communications. In theory, Cable One (CABO), a broadband provider with a focus on rural markets in the Midwest, Northwest, and Southeast, should have rallied in the fourth quarter as long-term interest rates began to fall. But 2023 turned out to be a challenging year for broadband providers all around, including CABO, whose shares are down more than 15% since mid-October.
Thanks to rising rates between January and late October, the number of families moving fell to a multi-year low, as existing home sales sank to 2010 levels. This is an important metric since every move creates an opportunity for companies like CABO to win new customers. The fact that mortgage rates have fallen from nearly 8% at the start of November to approximately 7% today provides some relief but borrowing costs have not fallen enough to trigger a recovery in moves.
This lack of new customer acquisitions has exacerbated concerns about rising competition from alternative modes of internet, mainly fiber-to-the-home and fixed-wireless access. While we believe CABO is relatively well insulated from this competitive pressure, the lack of new customer additions is fueling the current overhang.
Management is reacting to the soft environment by testing new lower price offerings capable of attracting a new customer base. Longer term, moving activity should rebound, resulting in better customer acquisition opportunities. Meanwhile, the stock trades at 7.2 times Enterprise Value to EBITDA, which compares favorably to its median post-spinoff multiple of 11.1 and the 11.0 multiple for the Russell 3000® Value Index.
Outlook
While those who bet on speculative, highly leveraged stocks won the fourth quarter, quarterly performance is not our objective. Our goal is to create consistent, lasting value for our shareholders over the long term. We cannot predict whether the soft-landing narrative will prove true at the end of the day. We simply believe that a balanced approach, which leaves open the possibility that the Goldilocks scenario could turn out to be right or wrong, is the wisest way to approach any market.