Heartland Advisors

Heartland Small Cap Value Strategy 1Q24 Portfolio Manager Commentary

 Executive Summary

  • In a challenging quarter for small caps, the Heartland Small Cap Value Strategy returned 8.64%, outpacing the 2.9% gain for the benchmark. 
  • This is a classic value investor’s market, with the Russell 2000® Index trading at historic discounts to large stocks.   
  • While it’s impossible to tell when market leadership will broaden out, historically small caps have been strong beneficiaries of interest rate cuts.

“It requires strength of character in order to think and to act in opposite fashion from the crowd and also patience to wait for opportunities that may be spaced years apart.”
 — Benjamin Graham

At year end, based on a historic valuation gap, we professed our enthusiasm for small stocks versus their mega-cap brethren. Mr. Market proved us wrong, with the S&P 500 up 10.6% in the first quarter, compared with the Russell 2000® Value Index, which was up only 2.9%. In the long run, we’re confident a portfolio selected on the merits of low price to earnings and low debt with strong revenue growth prospects makes sense.

Our confidence is couched in classic Ben Graham value investing principles.* 

The Small Cap Value Strategy is priced at 12X estimated profits for an 8% earnings yield (calculated by inverting the P/E ratio). According to Graham, to account for equity risk, earnings yields should exceed payouts available in the bond market. Also in our view, the Strategy’s P/E is attractive to the S&P 500’s 22X multiple.

Yet investors often overlook opportunities in undervalued parts of the market because they get caught up in popular names that grab the headlines. Thus, Ben believed it takes strength of character and patience to wait for openings that others don’t see.
What might be the catalyst that will shift the spotlight to the value present among small caps?

Small stocks took a disproportionate hit when interest rates began to rise two years ago on the belief that emerging companies rely more on bank financing than blue chips. By that token, they should be early beneficiaries once the Federal Reserve begins to loosen monetary policy, which is expected to start later this year.

These businesses — and the executives who run them — are also out to prove their worth. In the face of low investor interest, we are witnessing a growing number of firms stepping up on attractive valuations by instituting share buybacks. At the same time, insiders at these companies are increasingly buying their own shares. 

This part of the market also enjoys another advantage: If investors are concerned about the possibility of a recession lurking around the corner, many small businesses have already experienced a de facto downturn. Their equity prices, on a relative basis compared with S&P 600 companies, are at their lowest levels since 2000, which, by the way, proved to be a great time to be buying small caps (see chart below).

S&P 100 vs. Russell 2000®

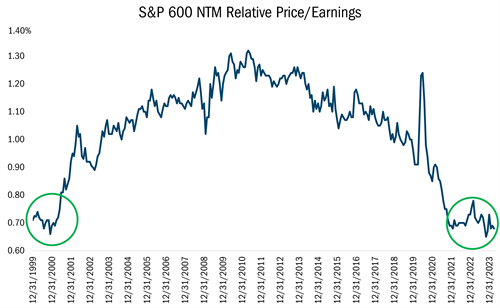
Source: FactSet Research Systems Inc., monthly data from 12/31/1999 to 3/31/2024. This chart represents the S&P 600 next twelve months relative price to earnings ratio. All indices are unmanaged. It is not possible to invest directly in an index. Past performance does not guarantee future results.

Attribution Analysis & Portfolio Activity

For the quarter, the Strategy returned 8.64%, outperforming the 2.9% gain for the Russell 2000® Value Index. Almost all of that was attributable to stock selection, which was particularly strong in the Financial, Industrials, and Consumer Discretionary sectors. 
After the market’s recent run-up, the opportunity set doesn’t appear as attractive as it was last Fall, even within the small value universe. There are fewer compelling buys, and we remain focused on a balanced approach driven by a risk-reward mindset.

We continue to focus on taking what the market gives us while waiting for fat pitches to come our way. This quarter, for instance, we started a new position in Chart Industries, Inc. (GTLS). We’ve been monitoring the stock for years and finally saw the buying opportunity we’ve been waiting for. As the leading producer of equipment for the shipment of liquefied natural gas (LNG), Chart Industries sold off sharply on the Biden Administration's decree to pause new export permits.

We view the pause as a short-term political action in anticipation of the coming election. In any case, GTLS has robust backlogs for the next several years. And if the U.S. truly slows, Chart, an international provider, should benefit as the rest of the world accelerates LNG development.

With an improved outlook due to the growth of a 2023 acquisition and its integration, Chart provides a broad product line across vast global end markets. This includes leadership in heat transfer systems and gaseous equipment used as alternatives to traditional fuels in hydrogen, carbon capture, and water treatment.

Chart’s Q4 was better than expected with record orders and increased sales, gross profit margin, operating income, and free cash flow. Due to above-plan integration synergies, GTLS built cash, paid down debt, and earned a recent upgrade in its bond rating. Now that one third of its revenues are coming from short-cycle maintenance and service, added benefits include higher margins and increased sustainability.

The company guided to another record year. We estimate sales of $4.8 billion, up from $3.7 billion in ’23. Adjusted earnings per share are estimated at $12, versus $6.09 a year ago. Priced at 8.3X estimated EBITDA, a substantial discount to peers, we view Chart Industries as an attractive value.

We believe Chart represents a better opportunity in the Industrials sector than other previous holdings. 

Elsewhere in our portfolio, we added to our position in the consumer health goods company Perrigo (PRGO) in the fourth quarter after its sell off, which was largely driven by troubles in the company’s infant nutrition business. 

Last September, the Food and Drug Administration updated guidelines for the agency’s approach to inspections and compliance for infant formula production. This included more frequent cleaning of its facilities, which resulted in slowing output. We see the manufacturing headwind in this space as a temporary challenge. Perrigo, in fact, recently provided an encouraging update on its remediation efforts. 

Ongoing progress on the issue should help refocus investors on the positive developments underway. This includes making its U.S. business, which is largely focused on lower-cost and lower-margin private label brands for retailers like Walmart and CVS, more like its European business, which focuses on higher-margin national brands. The good news: It can make this transition while utilizing its existing distribution and manufacturing footprint. Perrigo is also in the process of eliminating unproductive product lines, as more than 1,500 items drive just 1% of operating profit.

Meanwhile, the stock is enjoying considerable insider buying, and we believe it is attractively priced at just 12.2 times earnings.

Outlook

The first quarter demonstrated that investors aren’t quite ready to give up the mega-cap growth ghost. Yet, in our opinion, this does not detract from the historic appeal of small value. The part of the market we have devoted more than 40 years researching has only sold at such steep discounts relative to large caps three other times. The market may not be paying attention now, but we are convinced it eventually will. As value investors, it’s our job to remain disciplined and focused on the fundamentals until that happens. We will continue to use our 10 Principles of Value Investing™ to guide us, helping us find opportunities with low prices relative to earnings and cash flow to create a margin of safety.

Fundamentally and patiently yours,
The Heartland Investment Team

* If you’d like to learn more about the principles of value investing and want a free copy of Ben Graham’s The Intelligent Investor, we would be happy to send you one, until supplies last. Please contact us at 414-977-8746.

Please wait while we gather your results.

Portfolio Management Team

Heartland Advisors Value Investing Portfolio Manager Will Nasgovitz

Will Nasgovitz

CEO and Portfolio Manager

Heartland Advisors Value Investing Portfolio Manager Bill Nasgovitz

Bill Nasgovitz

Chairman and Portfolio Manager

Composite Returns*

3/31/2024

Scroll over to view complete data

Since Inception (%)10-Year (%)5-Year (%)3-Year (%)1-Year (%)YTD (%)QTD (%)
Small Cap Value Composite (Net of Advisory Fees)**10.743.5310.604.8413.208.728.72
Small Cap Value Composite (Net of Bundled Fees)9.273.1010.294.5312.868.648.64
Russell 2000® Value10.016.878.172.2218.752.902.90

Source: FactSet Research Systems Inc., Russell Investment Group, and Heartland Advisors, Inc.
*Yearly and quarterly returns are not annualized. The Strategy's inception date is 10/1/1988. 
**Shown as supplemental information. 

The US Dollar is the currency used to express performance. Returns are presented net of advisory fees and net of bundled fees and include the reinvestment of all income. The returns net of bundled fees were calculated by subtracting the highest applicable sponsor portion of the separately managed wrap account fee from the net of advisor fees return.

Small Cap Value Strategy Quick Links

Factsheet


Download PDF

Commentary


View Commentary

Attribution & Contribution Reports

Sign In

Holdings


Sign In


Email Sign Up


©2024 Heartland Advisors | 790 N. Water Street, Suite 1200, Milwaukee, WI 53202 | Business Office: 414-347-7777 | Financial Professionals: 888-505-5180 | Individual Investors: 800-432-7856

Past performance does not guarantee future results.

The Small Cap Value Strategy seeks long-term capital appreciation by investing in micro- and small-cap companies, generally with market capitalizations of less than the largest companies in the Russell 2000 Value Index, at the time of purchase. The micro- and small-cap segment of the stock market is robust with thousands of publicly traded issues, many of which lack traditional Wall Street research coverage. Thus, we believe this market is often inefficient, mispricing businesses and offering opportunities for fundamental research-minded investors such as Heartland.

The Small Cap Value Strategy invests in small companies selected on a value basis. Such securities generally are more volatile and less liquid than those of larger companies.

Value investments are subject to the risk that their intrinsic value may not be recognized by the broad market.

Heartland Advisors, Inc. (the "Firm") claims compliance with the Global Investment Performance Standards (GIPS®). The Firm is a wholly owned subsidiary of Heartland Holdings, Inc., and is registered with the Securities and Exchange Commission. For a complete list and description of Heartland Advisors composites and/or a presentation that adheres to the GIPS® standards, contact the Institutional Sales Team at Heartland Advisors, Inc. at the address listed below.

As of 3/31/2024, Chart Industries, Inc. (GTLS) and Perrigo Co. PLC (PRGO) represented 4.88% and 5.30% of the Small Cap Value Composite’s net assets, respectively.  

The future performance of any specific investment or strategy (including the investments discussed above) should not be assumed to be profitable or equal to past results. The performance of the holdings discussed above may have been the result of unique market circumstances that are no longer relevant. The holdings identified above do not represent all of the securities purchased, sold or recommended for the Advisor’s clients.

Portfolio holdings are subject to change. Current and future portfolio holdings are subject to risk.

In certain cases, dividends and earnings are reinvested.

GIPS® is a registered trademark of CFA Institute. CFA Institute does not endorse or promote this organization, nor does it warrant the accuracy or quality of the content contained herein.

Separately managed accounts and related investment advisory services are provided by Heartland Advisors, Inc., a federally registered investment advisor. ALPS Distributors, Inc., is not affiliated with Heartland Advisors, Inc.

The statements and opinions expressed in this article are those of the presenter(s). Any discussion of investments and investment strategies represents the presenters’ views as of the date created and are subject to change without notice. The opinions expressed are for general information only and are not intended to provide specific advice or recommendations for any individual. The specific securities discussed, which are intended to illustrate the advisor’s investment style, do not represent all of the securities purchased, sold, or recommended by the advisor for client accounts, and the reader should not assume that an investment in these securities was or would be profitable in the future. Certain security valuations and forward estimates are based on Heartland Advisors’ calculations. Any forecasts may not prove to be true. 

Economic predictions are based on estimates and are subject to change.

There is no guarantee that a particular investment strategy will be successful.

Sector and Industry classifications are sourced from GICS®.The Global Industry Classification Standard (GICS®) is the exclusive intellectual property of MSCI Inc. (MSCI) and S&P Global Market Intelligence (“S&P”).  Neither MSCI, S&P, their affiliates, nor any of their third party providers (“GICS Parties”) makes any representations or warranties, express or implied, with respect to GICS or the results to be obtained by the use thereof, and expressly disclaim all warranties, including warranties of accuracy, completeness, merchantability and fitness for a particular purpose.  The GICS Parties shall not have any liability for any direct, indirect, special, punitive, consequential or any other damages (including lost profits) even if notified of such damages.

Heartland Advisors defines market cap ranges by the following indices: micro-cap by the Russell Microcap®, small-cap by the Russell 2000®, mid-cap by the Russell Midcap®, large-cap by the Russell Top 200®.

Because of ongoing market volatility, performance may be subject to substantial short-term changes.

Dividends are not guaranteed and a company’s future ability to pay dividends may be limited. A company currently paying dividends may cease paying dividends at any time.

There is no assurance that dividend-paying stocks will mitigate volatility.

Russell Investment Group is the source and owner of the trademarks, service marks and copyrights related to the Russell Indices. Russell® is a trademark of the Frank Russell Investment Group.

Data sourced from FactSet: Copyright 2024 FactSet Research Systems Inc., FactSet Fundamentals. All rights reserved.

Heartland’s investing glossary provides definitions for several terms used on this page.

Buyback is the repurchase of outstanding shares (repurchase) by a company in order to reduce the number of shares on the market. Enterprise Value/Earnings Before Interest, Taxes, Depreciation, and Amortization (EV/EBITDA) Ratio is a financial indicator used to determine the value of a company and is calculated by dividing the entire economic value of the company (enterprise value) by its earnings before interest, taxes, depreciation, and amortization (EBITDA). Earnings Per Share is the portion of a company’s profit allocated to each outstanding share of common stock. Earnings Yield is the reciprocal of the price to earnings ratio.  Free Cash Flow is the amount of cash a company has after expenses, debt service, capital expenditures, and dividends. The higher the free cash flow, the stronger the company’s balance sheet. Insider Buying is the purchase of a company's stock by individual directors, executives or other employees. Margin of Safety is a principle of investing in which an investor only purchases securities when the market price is significantly below its intrinsic value. Price/Earnings Ratio of a stock is calculated by dividing the current price of the stock by its trailing or its forward 12 months’ earnings per share.  Russell Investment Group is the source and owner of the trademarks, service marks and copyrights related to the Russell Indices. Russell® is a trademark of the Russell Investment Group. Russell 2000® Index includes the 2000 firms from the Russell 3000® Index with the smallest market capitalizations. All indices are unmanaged. It is not possible to invest directly in an index. Russell 2000® Value Index measures the performance of those Russell 2000® companies with lower price/book ratios and lower forecasted growth characteristics. S&P 500 Index is an index of 500 U.S. stocks chosen for market size, liquidity and industry group representation and is a widely used U.S. equity benchmark. All indices are unmanaged. It is not possible to invest directly in an index. S&P 600 Index is a group of 600 U.S. stocks chosen for their market size, liquidity and industry group representation. All indices are unmanaged. It is not possible to invest directly in an index. 10 Principles of Value Investing™ consist of the following criteria for selecting securities: (1) catalyst for recognition; (2) low price in relation to earnings; (3) low price in relation to cash flow; (4) low price in relation to book value; (5) financial soundness; (6) positive earnings dynamics; (7) sound business strategy; (8) capable management and insider ownership; (9) value of company; and (10) positive technical analysis.

top